The modern ETF market is one of the fastest growing segments of global investing. Exchange traded funds today allow investors to implement nearly any strategy — from conservative wealth preservation to more dynamic thematic or factor based approaches.
To make the most of their potential, however, thoughtful preparation is essential. The foundation is a clear investment goal, a defined time horizon, and an understanding of the level of risk you’re willing to accept.
Only then can you select the right tools — the ETFs that most effectively help you reach that goal. Choosing an ETF isn’t just about finding the “cheapest” option. It requires careful evaluation of multiple factors: structure, taxation policy, liquidity, and the credibility of the issuer. Each of these can influence the final investment outcome.
Below are ten key areas worth analyzing when selecting an ETF.
Country of Domicile (Market)
The global ETF market can be divided into two main segments: the U.S. market and the European UCITS market, along with several smaller ones such as the Canadian, Australian and Asian markets. Each operates under different regulations, levels of accessibility, and tax implications.
U.S. ETFs
The United States remains the global leader in terms of innovation, liquidity, and scale. As of 2025, U.S. ETFs held more than USD 9.5 trillion in assets, representing over 70% of the global market. The advantages of U.S.-domiciled ETFs include:
- Very low management fees (TER often below 0.1%),
- Exceptional liquidity and tight bid‑ask spreads,
- Access to a vast range of thematic, sector, and factor strategies.
However, for most European retail investors, direct access to U.S. ETFs is restricted by MiFID II regulations and the lack of required Key Information Documents (KIDs). As a result, U.S. ETFs are typically available only through institutional accounts or specialized investment platforms.
European ETFs (UCITS)
In Europe, the standard structure is the UCITS ETF (Undertakings for Collective Investment in Transferable Securities). These funds adhere to strict European Union regulations that define risk limits, diversification requirements, reporting standards, and asset custody rules.
Most UCITS ETFs are domiciled in two countries:
- Ireland, which benefits from a favorable 15% U.S. dividend withholding tax rate (instead of the standard 30%),
- Luxembourg, known for legal flexibility and a strong regulatory framework for asset management.
UCITS funds domiciled in other EU countries exist but are less common due to tax and operational considerations.
From an investor’s perspective, it is crucial to note that dividend withholding tax is applied in the country where the ETF is domiciled, which leads to real differences in fund efficiency. For example, UCITS ETFs domiciled in Ireland often deliver higher net returns than equivalent funds based in Germany—precisely because of lower U.S. dividend withholding tax.
From an investor’s point of view, the country of domicile matters primarily in three areas:
- Taxation – especially the effective dividend withholding tax rate,
- Regulatory protection – UCITS ensures fund assets are held by a custodian and supervised by a financial authority,
- Distribution type – for distributing funds, domicile can influence net dividend flows.
Ultimately, most European investors choose UCITS ETFs domiciled in Ireland or Luxembourg, as they offer the most attractive balance of transparency, investor protection, and tax efficiency.
Fund Size (AUM)
Assets under management (AUM) are one of the primary indicators of an ETF’s quality. A large asset base suggests stability, investor confidence, and high liquidity — making it one of the first aspects worth checking before investing.
The larger the fund, the higher the likelihood it will remain on the market. ETF providers operate on a scale‑driven business model: if a fund fails to reach a sustainable AUM level (usually above EUR 100 million or USD 100 million), it may eventually be merged or liquidated due to operational inefficiency. For investors, that could mean needing to reinvest proceeds — and in some cases, triggering additional tax implications.
Liquidity is another crucial factor. ETFs with large AUM tend to attract more market participants and market makers, who continuously quote bid and ask prices. As a result, such funds typically have tighter bid‑ask spreads and allow easier execution of larger trades. Smaller ETFs, on the other hand, can be less actively traded, leading to higher transaction costs.
⚠️ Note: A market maker is a financial institution responsible for maintaining liquidity by continuously posting buy and sell quotes for a given instrument, such as ETFs.
When assessing ETF size, consider the following guidelines:
- Avoid ETFs below EUR 100 million (or USD 100 million) if they have been on the market for more than three years,
- Prefer funds with over EUR 500 million (or USD 500 million) for long‑term investing,
- Monitor AUM trends — whether assets are growing, stable, or declining,
- Compare with peers — significantly smaller funds in the same category may indicate limited investor interest or structural issues.
Fund size forms the foundation of ETF reliability analysis, but it should be considered alongside other criteria such as cost structure, tracking difference, and the issuer’s reputation.
⚠️ Note: Tracking difference measures how closely an ETF replicates the performance of its benchmark index. It is calculated as the difference between the ETF’s return and the index return over a selected period. The closer the tracking difference is to zero, the more accurately the ETF tracks its benchmark.
Provider
The choice of ETF provider is fundamental for investment security and transparency.
The largest ETF providers globally and in Europe include:
- iShares (BlackRock) – The world’s largest ETF issuer, headquartered in the U.S., holding over 30% of global ETF assets. Offers funds across all major asset classes, notably broad market indices (like MSCI World, S&P 500) as well as innovative thematic strategies. Known for outstanding liquidity and an extensive product suite (EUR/USD traded),
- Vanguard – The second-largest ETF provider, based in the U.S., famous for its relentless focus on low-cost investing. Flagship products include the Vanguard FTSE All-World UCITS ETF and a wide selection of international and bond ETFs (available in both Europe and U.S.),
- State Street Global Advisors (SPDR) – Headquartered in the U.S., best known for launching the SPDR S&P 500 ETF — the world’s oldest and most liquid ETF. Offers a wide range of sector and factor ETFs globally,
- Amundi – The leading European issuer, based in Paris. After acquiring Lyxor, Amundi boosted its range of bond, ESG, thematic, and ultra-low-cost “Prime” ETFs tracking broad indices like MSCI World or All Country World,
- Invesco – A global investment firm based in the U.S., providing a comprehensive range of UCITS ETFs listed on European exchanges. Recognized for competitive fees and strong offerings in key thematic segments,
- Xtrackers (DWS) – A German ETF brand operated by Deutsche Asset Management (DWS) and based in Frankfurt. Known for a broad selection of currency-hedged funds and solutions tailored to global equity and sector exposure,
- UBS – A leading Swiss investment bank and major UCITS ETF provider in Europe, specializing in ESG funds and institutional portfolio products, often with highly liquid equity and bond ETF line-ups.
All of these providers are established, regulated entities, setting European industry standards and recognized globally. Their ETFs are widely available across European and international trading platforms.
⚠️ Note: It’s worth comparing similar indices offered by different providers in terms of cost, liquidity, and tracking difference. Even with nearly identical strategies, small differences in product structure or management can impact investment results.
ETF Track Record/Fund Age
The track record of an ETF — that is, how long it has been on the market — is a key indicator of its credibility and stability. Funds with a longer operating history have demonstrated their ability to withstand the test of time, proving both consistent investor demand and commercial viability.
Preferably, look for ETFs that have been listed for at least 3–5 years. This period is sufficient to evaluate their efficiency, tracking difference, liquidity, real cost structure, and performance across different market cycles. Newly launched funds—especially thematic ETFs—may be interesting, but carry the risk of lower investor interest, smaller asset size, and a higher chance of being liquidated by the provider.
At the same time, remember that the ETF market is evolving rapidly, and new offerings often reflect current investment trends. However, for long-term portfolios, it’s generally wise to stick to established funds with a proven record and a stable position across various economic environments.
In practice, the age of the ETF signals stability, but it should not be the only criterion. For new funds, it is worth tracking whether assets are growing and if there is clear investor interest.
When evaluating “core” ETFs with several years of track record, it’s much easier for investors to assess their efficiency and forecast the likely future performance of the product.
⚠️ Note: The term “core” is used to describe funds designed to serve as the main, stable building blocks of an investment portfolio within a “core-satellite” strategy. In such strategies, the “core” typically consists of broad, low-cost ETFs that provide exposure to large markets or indexes, forming the foundation of the portfolio. “Satellite” positions are then used with more thematic or higher-risk products tailored to personal objectives. Core ETFs are known for low fees and broad, diversified benchmarks.
Management Costs
A major advantage of ETFs over traditional mutual funds is their much lower management costs. The key metric for investors is:
- Total Expense Ratio (TER) in Europe,
- Expense Ratio (ER) in the U.S.
The lower the TER/ER, the more of your investment stays in your portfolio, and reputable ETF providers actively compete to offer the lowest possible charges.
Currently, U.S.-domiciled ETFs are global leaders in low costs: the average TER there is about 0.14%. In Europe, the average TER is nearly double at around 0.26%, reflecting stricter regulations and higher operational expenses. The cheapest broad index ETFs (such as S&P 500, MSCI World) can charge below 0.10%, while specialized, actively managed, or thematic ETFs may cost substantially more — in some cases reaching 0.5–0.7% or higher.
However, management fees are only part of the story. ETFs can generate additional revenue from securities lending or tax optimization. As a result, the actual performance gap vs. the benchmark (tracking difference) can be narrower than the headline TER implies.
In fact, sometimes ETFs with higher TERs deliver better results than their cheaper competitors, especially if they are more tax-efficient on foreign dividends or manage their portfolio more effectively.
Essential rules for investors:
- Compare not just the stated TER, but pay attention to tracking difference — the final return gap between the ETF and its index,
- The simpler the fund strategy and the larger the fund’s scale, the lower the costs should be.
Remember: Multi-asset and commodity ETFs may lack a clear benchmark, so their costs are best analyzed by industry reviews or direct performance comparisons with competing products.
In summary: A lower TER is a distinct advantage, but what matters most is the realized net result after fees and taxes — in other words, tracking difference over several years of operation.
⚠️ Note: Management costs aren’t the only cost associated with ETF investing. There are also transaction costs, primarily broker commissions, which can vary significantly. To better understand all potential hidden or additional charges, it’s worth reading the article “The Hidden Costs of Investing – How Not to Lose a Fortune on Small Fees.”
Dividend Distribution Policy
When an ETF invests in stocks, bonds, or other financial instruments, it generates income in the form of dividends and interest.
The fund can choose between two basic approaches to handling these cashflows:
- ETF Accumulating (Acc): Profits are reinvested within the fund, automatically increasing the value of each share and allowing investors to benefit from compound growth. This model is particularly tax-efficient for long-term investors, as taxes on gains generally arise only when ETF shares are sold,
- ETF Distributing (Dist): Dividends and interest are paid out directly to investors, usually on a quarterly or semi-annual basis. This provides a regular cash flow to a brokerage account and is often preferred by investors focused on dividend strategies or seeking passive income.
In Europe, the majority of UCITS ETFs are available in both accumulating and distributing versions, allowing investors to choose based on their own preferences and investment horizons. In practice, “Acc” share classes tend to be more suitable for long-term investors looking to automatically reinvest returns, while “Dist” share classes are better for those seeking regular income (such as retirees or individuals building a passive income stream).
In the United States, distributing ETFs are standard, with regular payouts (usually quarterly or monthly) and few accumulating alternatives.
In summary, the choice between “Acc” and “Dist” should be guided by your personal tax situation and income management needs. For most investors focused on accumulating capital, the accumulating share class is more advantageous, while those interested in generating passive income or funding current expenses may prefer the distributing share class.
Currencies
Currency risk arises when the currency of the assets held by the ETF is different from the investor’s home currency.
For example, an ETF investing in U.S. stocks, like an S&P 500 tracker, provides exposure to the U.S. dollar (USD), regardless of whether the fund itself is listed in EUR, GBP, or another currency. For a European investor holding such an ETF, the real exposure is to USD, not EUR.
ETFs tracking the same index are often available in two versions:
- Unhedged: Exposed to currency fluctuations between the asset currency and the investor’s currency,
- Currency-hedged: Designed to neutralize exchange rate risk, especially common for bond funds or low-volatility instruments where FX movements can have a significant impact. Currency hedging uses financial contracts to offset potential losses from changes in exchange rates, ensuring that currency movements have a minimal effect on the investor’s returns.
ETFs can be listed on multiple exchanges in different currencies:
- New York (USA): USD
- Frankfurt (Germany): EUR, USD
- London: GBP, USD
- Zurich: CHF, EUR, USD
A single ETF may be available and traded simultaneously in several currencies and markets. The listing currency affects investment convenience and transaction costs (e.g., USD bank wires may incur fees, while EUR SEPA transfers are typically free), but it does not determine the underlying currency risk.
Additionally, liquidity can vary depending on the listing: for example, an ETF traded in GBP on the London Stock Exchange may see less trading activity than the same ETF listed in USD on a major American exchange. In some cases, certain ETFs are listed and available only on a specific market and currency, as determined by the issuer.
In summary, when assessing currency risk, it is crucial to focus on the currency of the assets held by the ETF, not the currency in which it is listed.
Index Replication — Method Selection and ETF Efficiency
ETFs tracking the same index can employ various methods of replication, which influence transparency, cost, counterparty risk, and how the fund generates returns.
- Full Physical Replication: The ETF buys all the underlying assets of the index in the exact same proportions as the benchmark. This approach ensures maximum transparency and minimizes counterparty risk, and is most frequently used for large and liquid indices,
- Partial Physical Replication (Sampling): The fund holds a representative sample of the index components rather than every single constituent. This is efficient for very broad or logistically complex indices where full replication would be costly or impractical. For example, a European equity ETF may invest in a carefully selected group of companies that capture the key characteristics of the benchmark,
- Synthetic Replication (Swap-Based): The ETF uses derivatives, mainly swaps, to mirror the index returns instead of holding the physical assets. This method is indispensable for certain commodity indices (excluding precious metals), some emerging markets, or to optimize the withholding tax rate on dividends. In Europe, S&P 500 ETFs with synthetic replication sometimes outperform physical counterparts due to tax efficiency on U.S. dividends,
- Hybrid Replication: The portfolio is partly physically replicated and partly synthetic (via swaps), offering a balance between the flexibility of synthetic methods and the transparency of physical holdings. This is mostly seen in global indices or highly complex markets.
The principle of “invest in what you understand” applies to replication methods as well. Most investors tend to favor physically replicated ETFs due to their simplicity and transparency. In practice, most methods yield similar results, but certain situations highlight the advantages of one approach over another — for example, synthetic S&P 500 ETFs sometimes deliver better after-tax performance in Europe, while commodities (other than precious metals) generally require synthetic structures.
The key is to choose the replication method with full awareness, based on the fund’s documentation and an understanding of the implications for risk, fees, and compatibility with your investment objective.
ETF Liquidity
Liquidity is one of the key parameters impacting both the cost and comfort of ETF investing, particularly for investors pursuing short-term strategies or frequently trading in large volumes. The easiest way to evaluate an instrument’s liquidity is by looking at the spread—the difference between the best available bid and ask. Higher liquidity means lower transaction spreads, making it less likely for large orders to be filled at disadvantageous prices.
Two ETFs tracking the same market or index can vary significantly in liquidity, depending on their popularity, market maker activity, and turnover on a given exchange.
- For active traders and short-term investors, selecting instruments with high liquidity and low spreads can have a substantial impact on total investment returns,
- For long-term investors, spreads tend to be a marginal cost.
ETF markets use several standard liquidity metrics:
- Xetra Liquidity Measure (XLM): A free metric published by the Xetra exchange (Frankfurt), showing the true transaction cost (roundtrip cost) for a standard order size (e.g., EUR 10,000/USD 10,000). XLM considers both spread and market depth, indicating the cost of entering and exiting a position in basis points. All instruments listed on Xetra have this data publicly available,
- Average Daily Best Spread (ADBS): The average daily spread of top quotes, published by Bloomberg terminals and certain brokerage platforms. This is a paid tool, enabling direct comparisons of real trade costs for similar ETFs, especially for large transactions.
In practice, when comparing ETFs with the same exposure, it’s advisable to pick those with the highest liquidity and lowest spreads. It’s also important to take into account where and in which currency the majority of trading occurs, as these factors affect both convenience and execution efficiency.
In summary: Liquidity is especially important for high-frequency or large trades. For buy-and-hold investors it’s less critical, but it’s always advisable to check liquidity using public metrics like XLM or ADBS.
ETF Ratings
Many ETF research platforms, such as ETFatlas, provide star ratings for ETFs, typically on a scale from 1 to 5 stars (1 = lowest, 5 = highest).
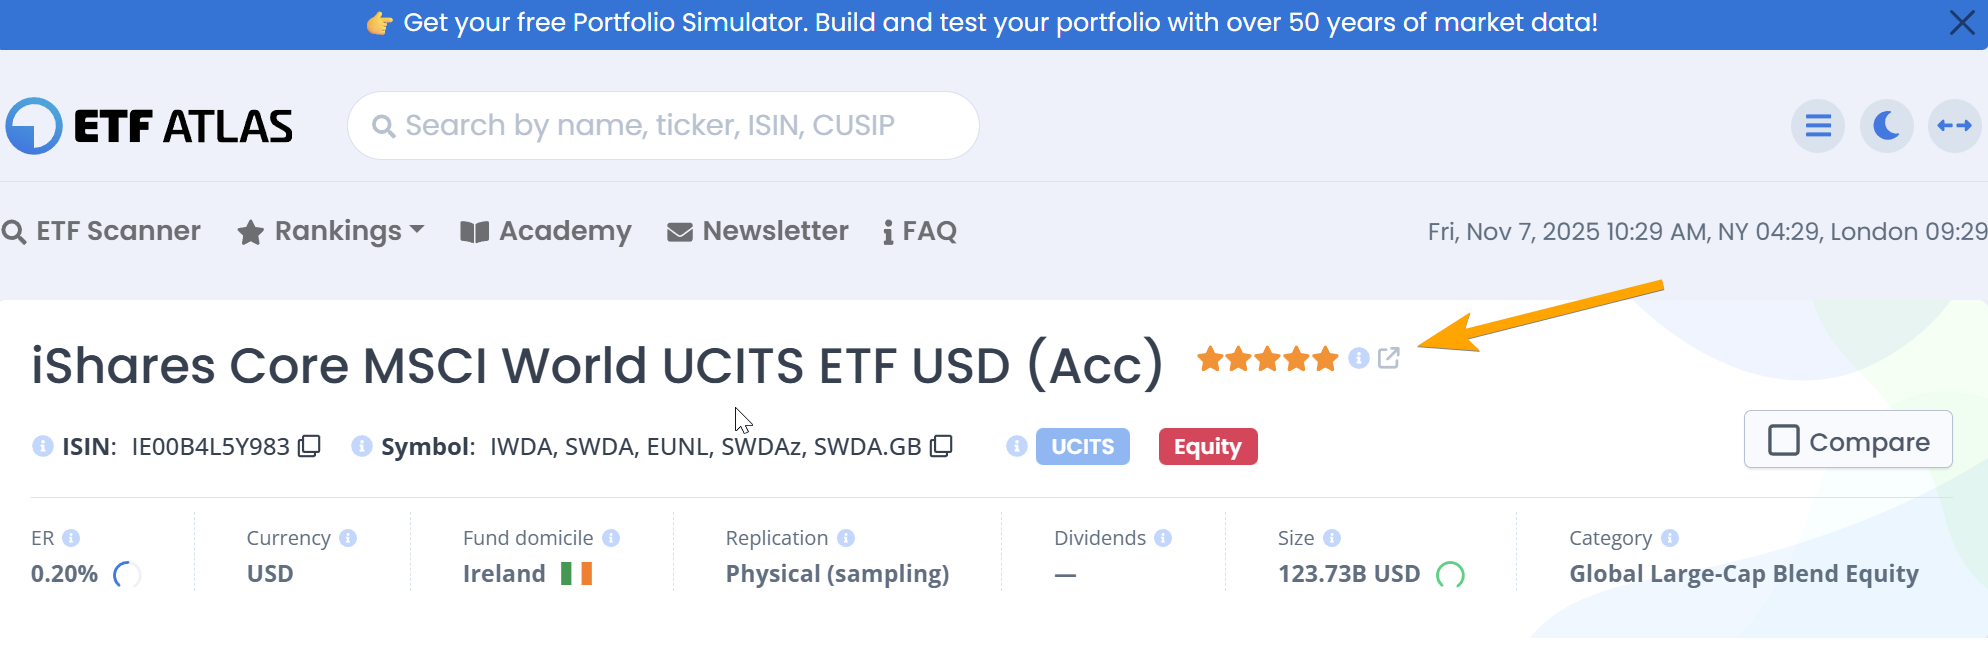
The star rating system developed by Morningstar is a practical tool that helps investors quickly and objectively assess the quality and risk level of a selected ETF, based on detailed financial analysis and peer comparison within each fund category. Ratings are updated regularly, ensuring that investors receive a current and reliable snapshot of each fund’s condition, rather than just relying on historical returns.
A fund’s star rating reflects both stable performance and risk control—penalizing excessive volatility and rewarding consistent results, making it easier to identify leading funds and those that warrant extra caution. Despite the intuitive nature of this system, ratings should not be the sole criterion when making investment decisions; five stars indicate a strong candidate for further due diligence, not a guarantee of future returns.
Morningstar recalculates these ratings monthly using a sophisticated methodology. The system compares risk-adjusted returns (Morningstar Risk-Adjusted Return, MRAR) over three, five, and ten years against other funds in the same category. The top 10% of funds receive five stars, the next 22.5% four stars, and so on, with the rating distribution strictly defined.
It’s important to compare star ratings only within the same category (e.g., equity vs. bond funds), since five stars in one category do not mean the fund is “better” than a four-star fund in a different class.
While Morningstar ratings offer a user-friendly filter grounded in sound mathematical analysis and regularly refreshed data, investors should treat them as a starting point for further research—examining the fund strategy, portfolio structure, and how well the ETF matches personal investment goals.