February 2026 brought something we haven’t seen in years: the BofA Bull & Bear Indicator hit 9.5 – “hyper-bull” territory, sustaining a contrarian sell signal that has been active since mid-December 2025 . A record 52% of global fund managers expect a “no landing” scenario for the world economy, and combined equity and commodity exposure has reached 76% – a level last seen at the start of 2022, right before a global bear market . In this article, we show how individual investors can use both global sentiment gauges – including the AAII Investor Sentiment Survey – to honestly assess their own risk tolerance and apply simple risk control tools, regardless of what market noise is suggesting.
What Is Extreme Optimism and How Do We Measure It?
Market sentiment is the collective attitude of investors toward the future – measured through surveys, cash levels in portfolios, and the put-to-call ratio. When sentiment reaches extremes, it becomes a contrarian indicator – paradoxically signalling potential trend reversal risk, because there are no more new buyers willing to enter the market at higher prices.
Global Sentiment Gauges: February 2026 Data
The February 2026 edition of the BofA Global Fund Manager Survey (FMS) documents the most bullish institutional investor positioning since June 2021. Key readings:
- The composite FMS sentiment score rose to 8.2 (from 8.1 in January), with the Bull & Bear Indicator at 9.5 – maintaining the contrarian sell signal from December 17, 2025
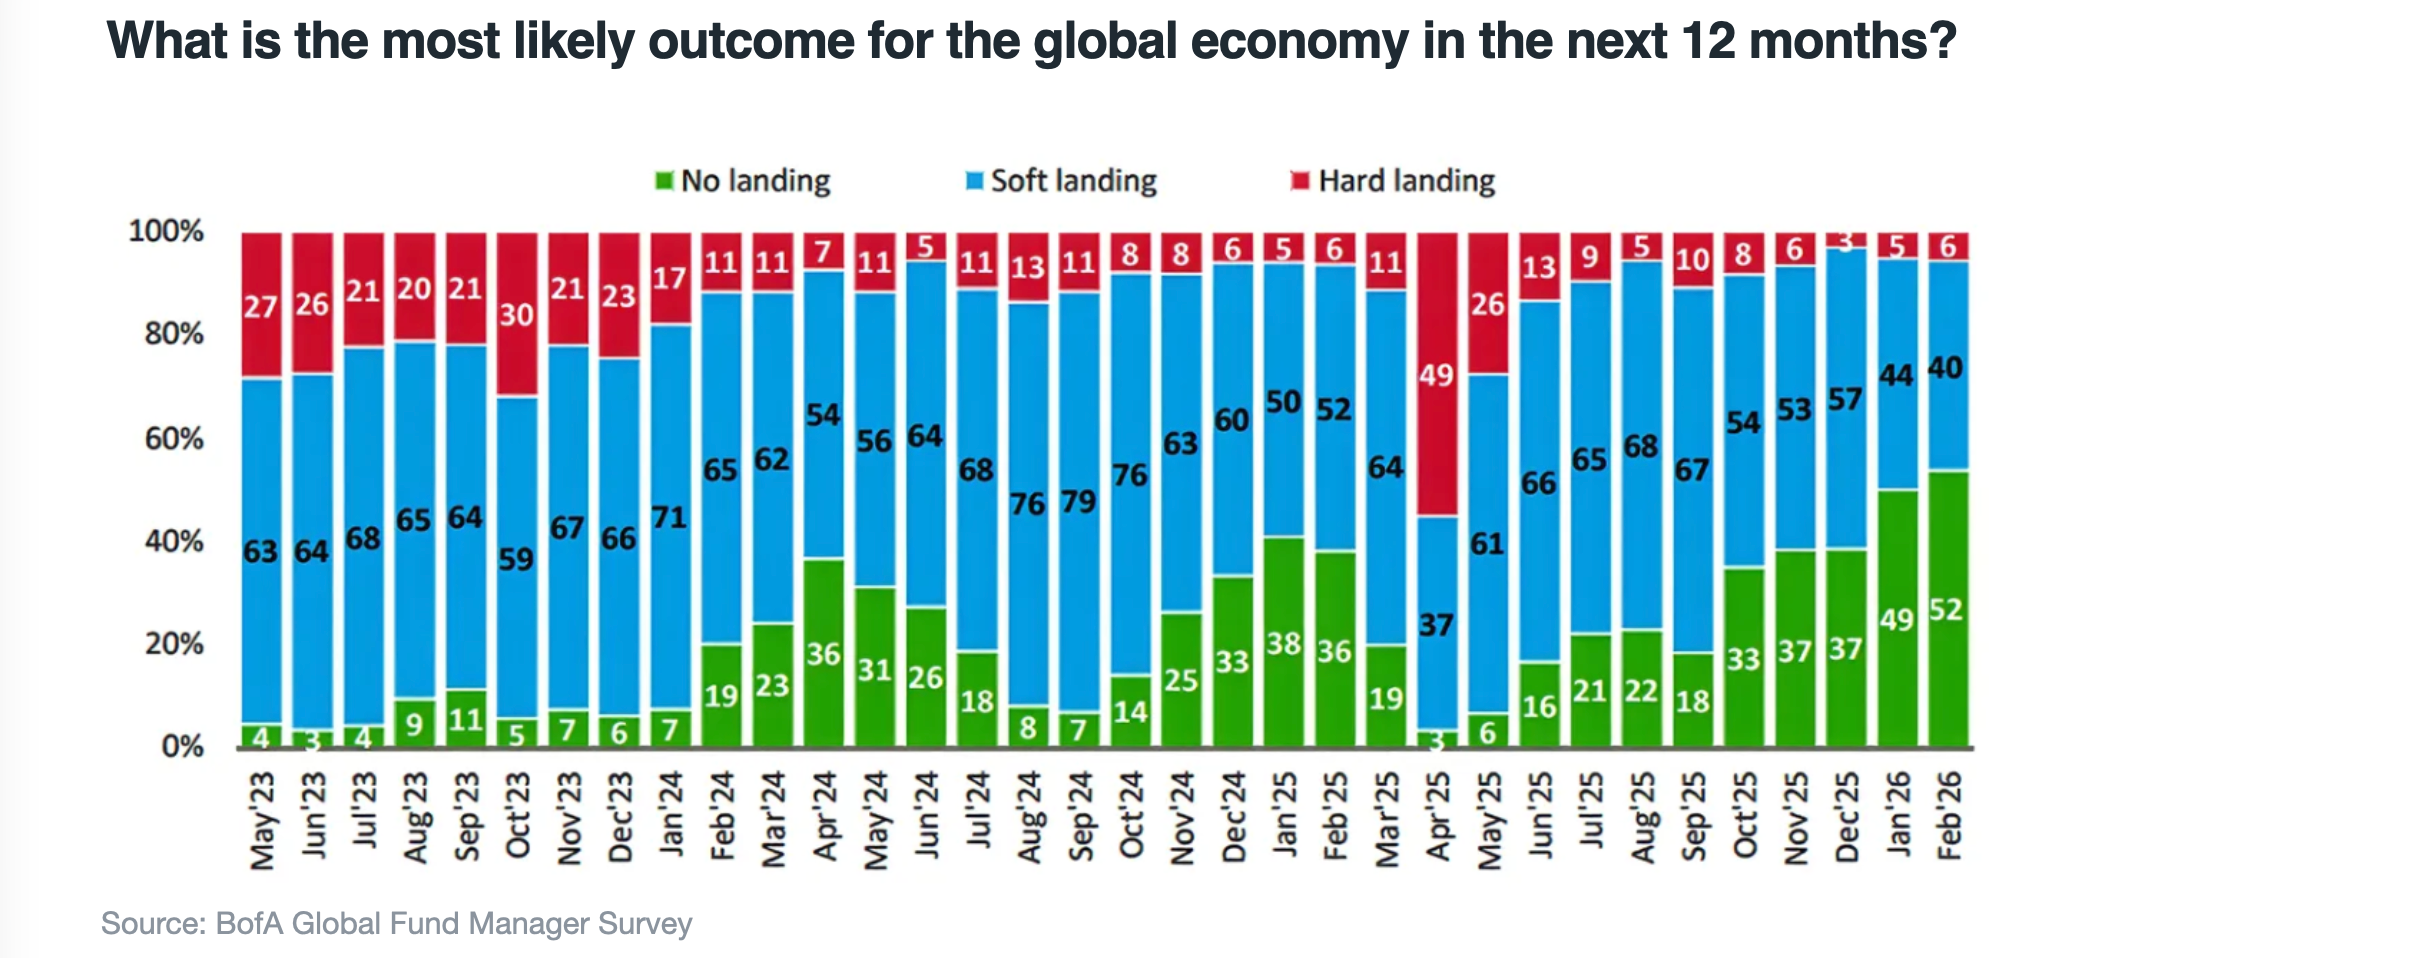
- Net 52% of managers expect the “no landing” scenario – an all-time record in the survey’s history
- Net 36% expect a “boom” scenario (above-trend growth + higher inflation) – highest since February 2022
- Net 24% expect double-digit global EPS growth – highest since August 2021
- Net 48% overweight global equities – highest since December 2024
- Combined equities + commodities exposure reached net 76% – the level from early 2022, just before the global bear market
- Cash levels ticked up slightly to 3.4% AUM from a record low of 3.2% in January – the first increase in 7 months, yet still historically very low
- Net 57% of managers expect long-term bond yields to rise – highest since February 2022
- Technology fell sharply in popularity: from net 19% overweight to just net 5% overweight, with capital rotating into Europe and emerging markets
The Individual Investor Gauge: AAII Sentiment Survey
For individual investors, the most widely followed retail sentiment tool is the AAII Investor Sentiment Survey, published weekly by the American Association of Individual Investors since 1987. Each week, members answer one question: Do you feel the direction of the stock market over the next six months will be up (bullish), no change (neutral), or down (bearish)?

The survey is free, open to everyone, and results are released every Thursday. Historically, AAII readings serve as a contrarian indicator: extreme bullishness has often preceded short-term market pullbacks, while extreme bearishness has coincided with attractive entry points. Notably, bullish sentiment reached 49.5% in mid-January 2026 – well above the long-term average of 37.6% – before retreating to 34.5% by February 19, 2026. This moderation is a reminder of how quickly crowd psychology can shift.
Practical tip: Participating in the AAII survey each week is not just about reading the data – it trains you to stop and consciously ask: What do I actually feel about the market right now, and does my portfolio reflect that?
The “No Landing” Scenario – What Is the Risk?
“No landing” is a scenario in which the US economy maintains above-trend growth without recession and without a meaningful cooling of inflation – neither a “hard landing” (recession) nor a classic “soft landing” (gradual deceleration). A record 52% of fund managers now treat this as their base case, while Bloomberg Consensus estimates US GDP growth at 2.4% for 2026, partly driven by AI-related investment.
The risk is not in the “no landing” scenario itself – it is possible. The risk lies in the fact that virtually the entire market is on the same side, leaving no room in portfolios for positive surprises. A single unexpected inflation print or a shift in Fed rhetoric could trigger a wave of forced position reduction.
Warning Signs the Market Is Ignoring
February’s BofA survey data points to several hidden tensions :
- Inflation expectations are returning – net 9% of managers expect higher global CPI year-over-year, a clear reversal of the deflationary mindset from early 2025; historically this correlates with late-cycle phases, not mid-cycle
- Record fear of AI overinvestment – a record net 35% of managers believe companies are overinvesting in AI (a 20+ year record), and the “AI bubble” is cited as the top tail risk by 25% of respondents
- Bonds deeply underweight – net 40% underweight in bonds, the deepest since September 2022; net 57% expect long yields to rise, which at current fiscal expansion levels could become a self-fulfilling prophecy
- Most crowded trades – “long gold” was cited by 50% of managers (second month running), well ahead of “long Magnificent Seven” (20%) and “short dollar” (12%)
- AI-critical commodities surged 135% over 12 months, potentially pushing inflation persistently above the Fed’s 2% target
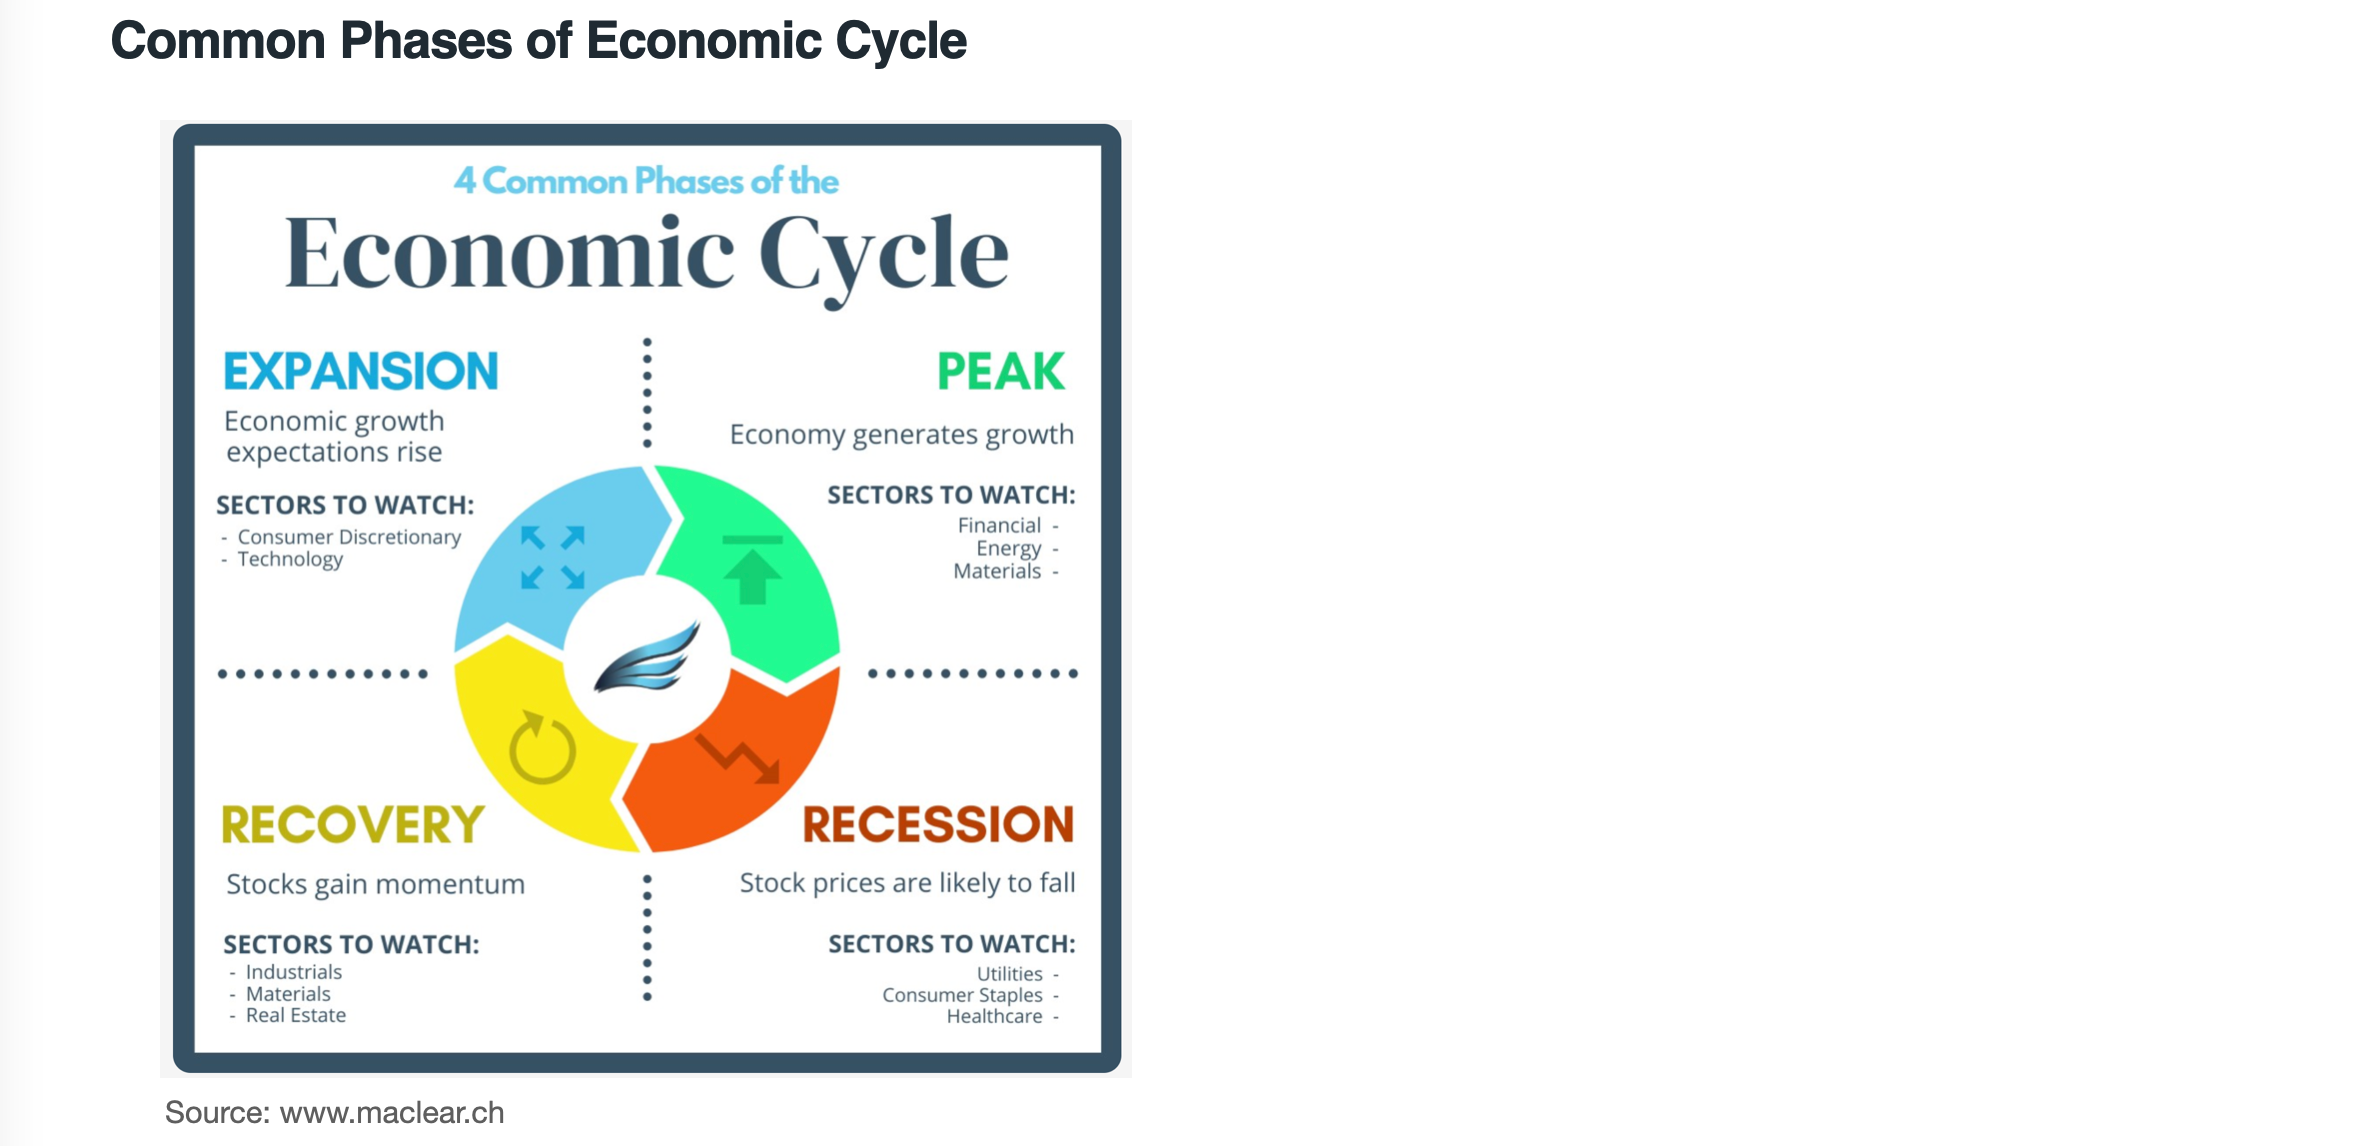
Where Are We in the Business Cycle?
It is useful to anchor all of this sentiment data within the broader framework of the business cycle. Economies typically move through four phases – recovery, expansion, slowdown, and recession – each characterised by a different combination of GDP growth, inflation dynamics, and interest rates. In the classic Fidelity business cycle model, equities tend to outperform in the early recovery phase, commodities in the late expansion phase when inflation accelerates, and bonds in the slowdown and recession phases as inflation and rates begin to fall.
Fidelity’s Asset Allocation Research Team characterises the late-cycle phase as one where the economic expansion matures, inflationary pressures continue to rise, credit conditions tighten, and early recessionary signs can begin to emerge. Crucially, late-cycle phases are associated with elevated market volatility and deteriorating risk-reward tradeoffs for equities relative to earlier phases. The returning inflation expectations in the BofA survey – net 9% expecting higher CPI – are consistent precisely with this late-cycle dynamic.
In practice, however, business cycle turning points only become clear in hindsight: macro data lags reality, and financial markets typically price in changes well in advance. This makes “textbook” rotation between asset classes extremely difficult to execute in real time for an individual investor. We therefore use the business cycle framework as a risk map rather than a trading instruction – a tool for checking whether our risk exposure is appropriate for the current phase, not for actively chasing sector or asset class rotations.
How to Assess Your Own Risk Tolerance
True risk tolerance reveals itself not during bull markets, but during drawdowns – and it is worth assessing it systematically before the market does it for you. We can build this assessment on three independent pillars (for a more detailed breakdown, see The Grable and Lytton risk-tolerance scale:A 15-year retrospective):
- Willingness to take risk (risk tolerance) – the subjective, psychological ability to stick to your strategy during drawdowns; research consistently shows that after extended bull markets, investors systematically overestimate their loss tolerance
- Ability to take risk (risk capacity) – an objective financial measure: can you absorb potential losses without disrupting your daily life? The longer your investment horizon and the more stable your income, the higher your capacity
- Need to take risk (risk need) – the level of risk required to achieve your financial goals; if goals are achievable with a conservative allocation, there is no rational reason to add unnecessary risk
Key takeaway: The right asset allocation is not the one that maximises expected return – it is the one you can maintain through a full market cycle, including a bear market.
How Investment Horizon Changes the Risk Equation
Counter-intuitively, a longer investment horizon does not just allow for higher equity exposure – it practically requires it, to adequately protect purchasing power against inflation over time. For an investor with low risk tolerance, research suggests optimal equity allocation may rise from around 20% at a 1-year horizon to 50% at a 20-year horizon. Equities are risky in the short term, but over the long run it is bonds that carry a serious risk – the risk of real purchasing power erosion through inflation.
Two Types of Risk: Which One Gets Rewarded?
Not all risks are equal:
- Systematic (market) risk – inherent in holding a diversified portfolio. The market compensates this risk with a long-term equity risk premium. We increase it by raising our equity allocation or adding small cap and value factor tilts
- Idiosyncratic (specific) risk – tied to a single company, sector, or country. Can be largely eliminated through diversification, and the market does not reward investors for bearing it
For the passive investor the conclusion is simple: if you want to take more risk, do it by adjusting your asset class mix (more equities vs. bonds), not by concentrating in a few stocks or one sector.
The “50% Drawdown” Test
Ask yourself a concrete question: If my $100,000 portfolio drops to $50,000 in 12 months – as the S&P 500 did in 2000–2002 and 2008–2009 – will I be able to hold without selling anything? If the answer is “I’m not sure” or “no” – your current risk level is too high, regardless of what the market is currently doing. Remember that February 2026’s combined institutional equity and commodity exposure stands at net 76% – if a sharp correction materialises, the scale of forced institutional selling could be exceptionally large, amplifying price swings for individual investors too.
Practical Self-Assessment Checklist
- I know my target allocation (e.g. 80% equities / 20% bonds) and can explain why
- I have checked the historical max drawdown of my portfolio (e.g. in Passive Portfolio Simulator)
- I have a written investment policy statement – even a one-pager – with rebalancing rules and concentration limits
- My safety cushion (6–12 months of expenses) sits outside my investment portfolio
- I have not increased portfolio risk simply because markets have recently grown faster than expected
- I monitor the AAII survey weekly and compare my emotional state to my actual portfolio allocation
Summary
Extreme market optimism is not a reason for panic – it is an excellent reason to pause and audit your portfolio. The February 2026 BofA survey data point to conclusion: the more unanimously everyone is positioned on one side, the smaller the shock needed to trigger a violent reaction. For the passive investor, the answer is always the same – return to the plan, check your allocation, rebalance, and resist both euphoria and panic.
What to Watch Carefully in 2026
- The “no landing” trap – a record 52% of managers assume this scenario when consensus is this unanimous, any deviation hits harder and faster than usual
- Inflation’s return – net 9% of managers expect higher CPI, which historically signals a late business cycle phase, not mid-cycle
- Bonds as the “surprise of the year” – at net 40% underweight, any deterioration in growth data could trigger a violent reversal in bond prices, catching many investors flat-footed
- AI bubble as top tail risk – 25% of managers flag it as the greatest tail risk, and a record net 35% believe companies are overinvesting. The dot-com bubble teaches us that sound technology does not protect against painful valuation corrections
- AAII bullish sentiment near cycle highs is a signal to review portfolio allocation, not to increase risk exposure
- FOMO (Fear of Missing Out) – rising markets tempt investors to add risk precisely when it is most expensive. True passive investing discipline means holding to the written plan, not to the impulse