Imagine it’s the year 2000. The Nasdaq is climbing 85% per year and everyone you meet is making a fortune on tech stocks. Your friends are quitting their jobs to trade full time. The media are announcing a “new era” of the digital economy where old valuation rules no longer apply. In a moment like that, you need nerves of steel to say: “No, thanks. That’s too expensive.”
Now it’s 2025. Has history come full circle? The US stock market is hitting new highs again, artificial intelligence promises a revolution comparable to the invention of the internet, and valuation metrics are back at levels last seen in 2000. Most investors look at the last decade of uninterrupted growth and think: “this time is different.” But is it really?
The problem with investing is not a lack of information – you are drowning in it. The problem is that your brain was shaped by evolution to survive on the savannah, not to make financial decisions in modern markets. As a result, you repeat the same mistakes generation after generation: you buy at the top when everyone is euphoric, and you sell at the bottom when panic is at its peak.
After reading this article, you will understand why looking in the rear‑view mirror – extrapolating the success of the last decade – is not the best strategy you can choose at this point in history. In investing, just like in poker, you don’t have to be a genius – you just need to be less irrational than the crowd.
Objective vs. Subjective Expectations: An Endless Battle
A fundamental problem in building an investment strategy is the way we form our expectations. We can distinguish two opposing approaches that often lead to completely different investment conclusions.
The first are subjective expectations. They are the domain of individual investors and are based on a simple psychological mechanism: extrapolation. When stock prices rise, investors feel wealthier and more confident, so their expectations for future returns rise as well. The logic is simple: “since things have been good recently, they will stay good.” This is classic procyclical thinking, where optimism peaks exactly at the top of the bubble.
The second approach is objective expectations. It is used not only by academics or professional investment funds, but also by any informed investor who bases decisions on hard data: current valuations, yields and earnings growth rates, etc. Here the logic is reversed: when stock prices rise faster than company earnings, valuations go up (for example, the price‑to‑earnings ratio increases), which mathematically lowers the expected rate of return in the future. This is anti‑cyclical thinking.
Expectation Conflict: Evidence from Research
Research presented by AQR Capital Management “Equity Market Focus: Subjective Expected Returns” highlights a stark contrast between the behaviour of different investor groups. Individual investors show a strong tendency to extrapolate, meaning their expectations for future returns rise after years of bull markets and fall after years of bear markets. Peak optimism was observed in 2000, just before the tech bubble burst, when objective valuation metrics were already signalling extreme overvaluation.
Institutional investors – asset managers, consultants and pension funds – behave in a more contrarian way. Their long‑term return assumptions are inversely correlated with market valuations: when valuation metrics are high (cyclically adjusted earnings are low), their expected returns are low, and vice versa.
In Chart A below, investor sentiment surveys (Gallup Bull‑Bear Spread) move in line with the previous year’s returns. In other words, when the past year’s performance was poor, the gap between bearish and bullish respondents widened in favour of pessimism.
The Gallup Bull‑Bear Spread is a market sentiment indicator that measures the difference between the percentage of investors who are bullish (expecting gains) and those who are bearish (expecting declines).
Chart B, in turn, shows that pension funds and asset managers had high return expectations in 2011–2013 (when CAEY – cyclically adjusted earnings yield – was high and stocks were cheap), and low expectations in 2021–2023 (when valuations were elevated).
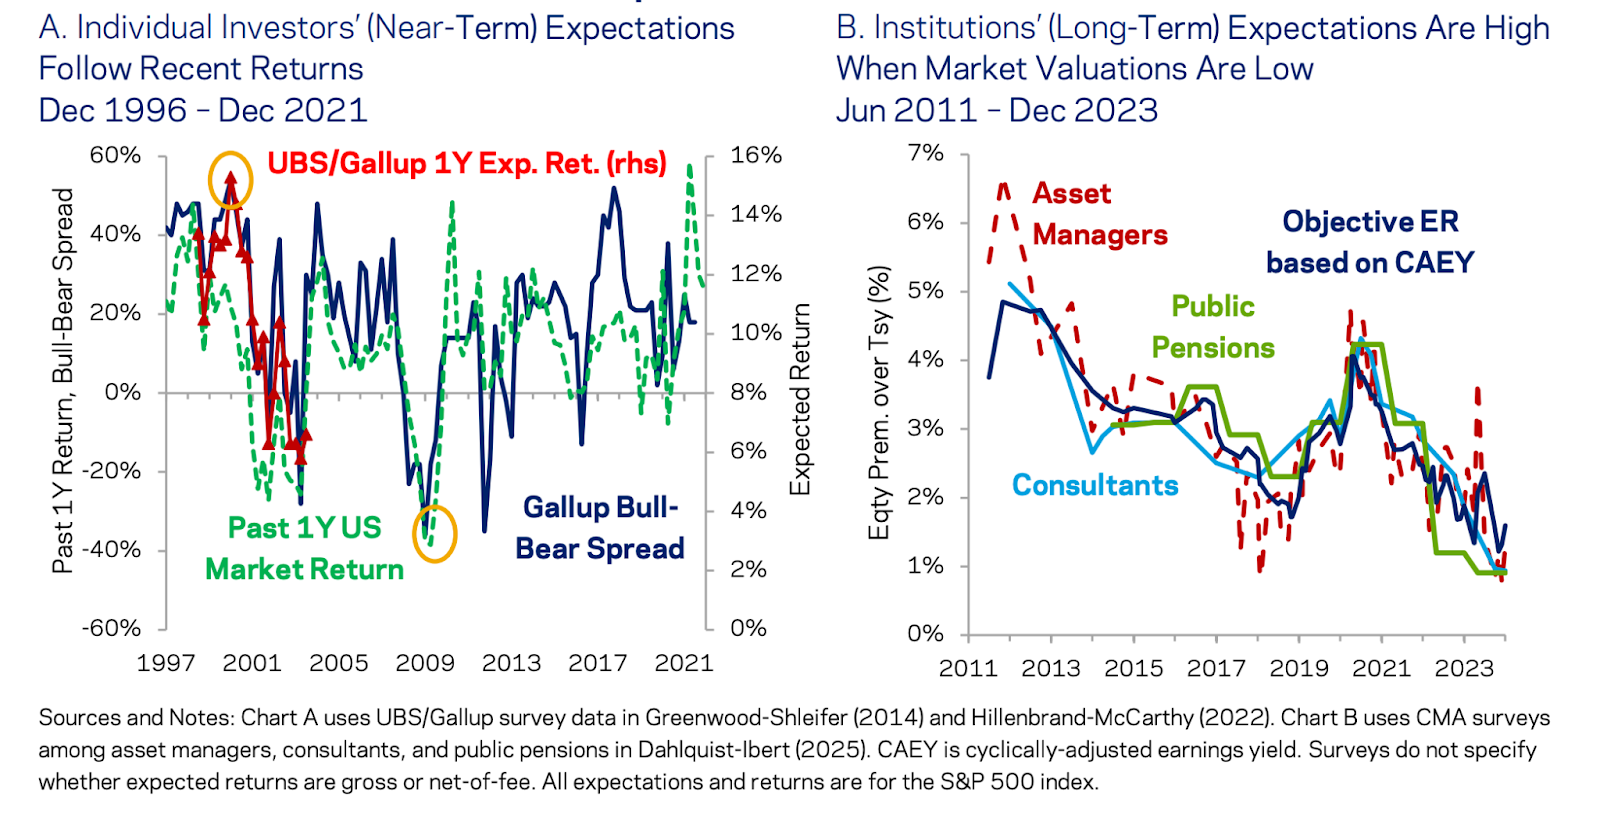
CAEY (Cyclically Adjusted Earnings Yield) is the inverse of the CAPE ratio (current price divided by the average of real, inflation‑adjusted earnings over the last 10 years) and is used to estimate long‑term real returns from the equity market.
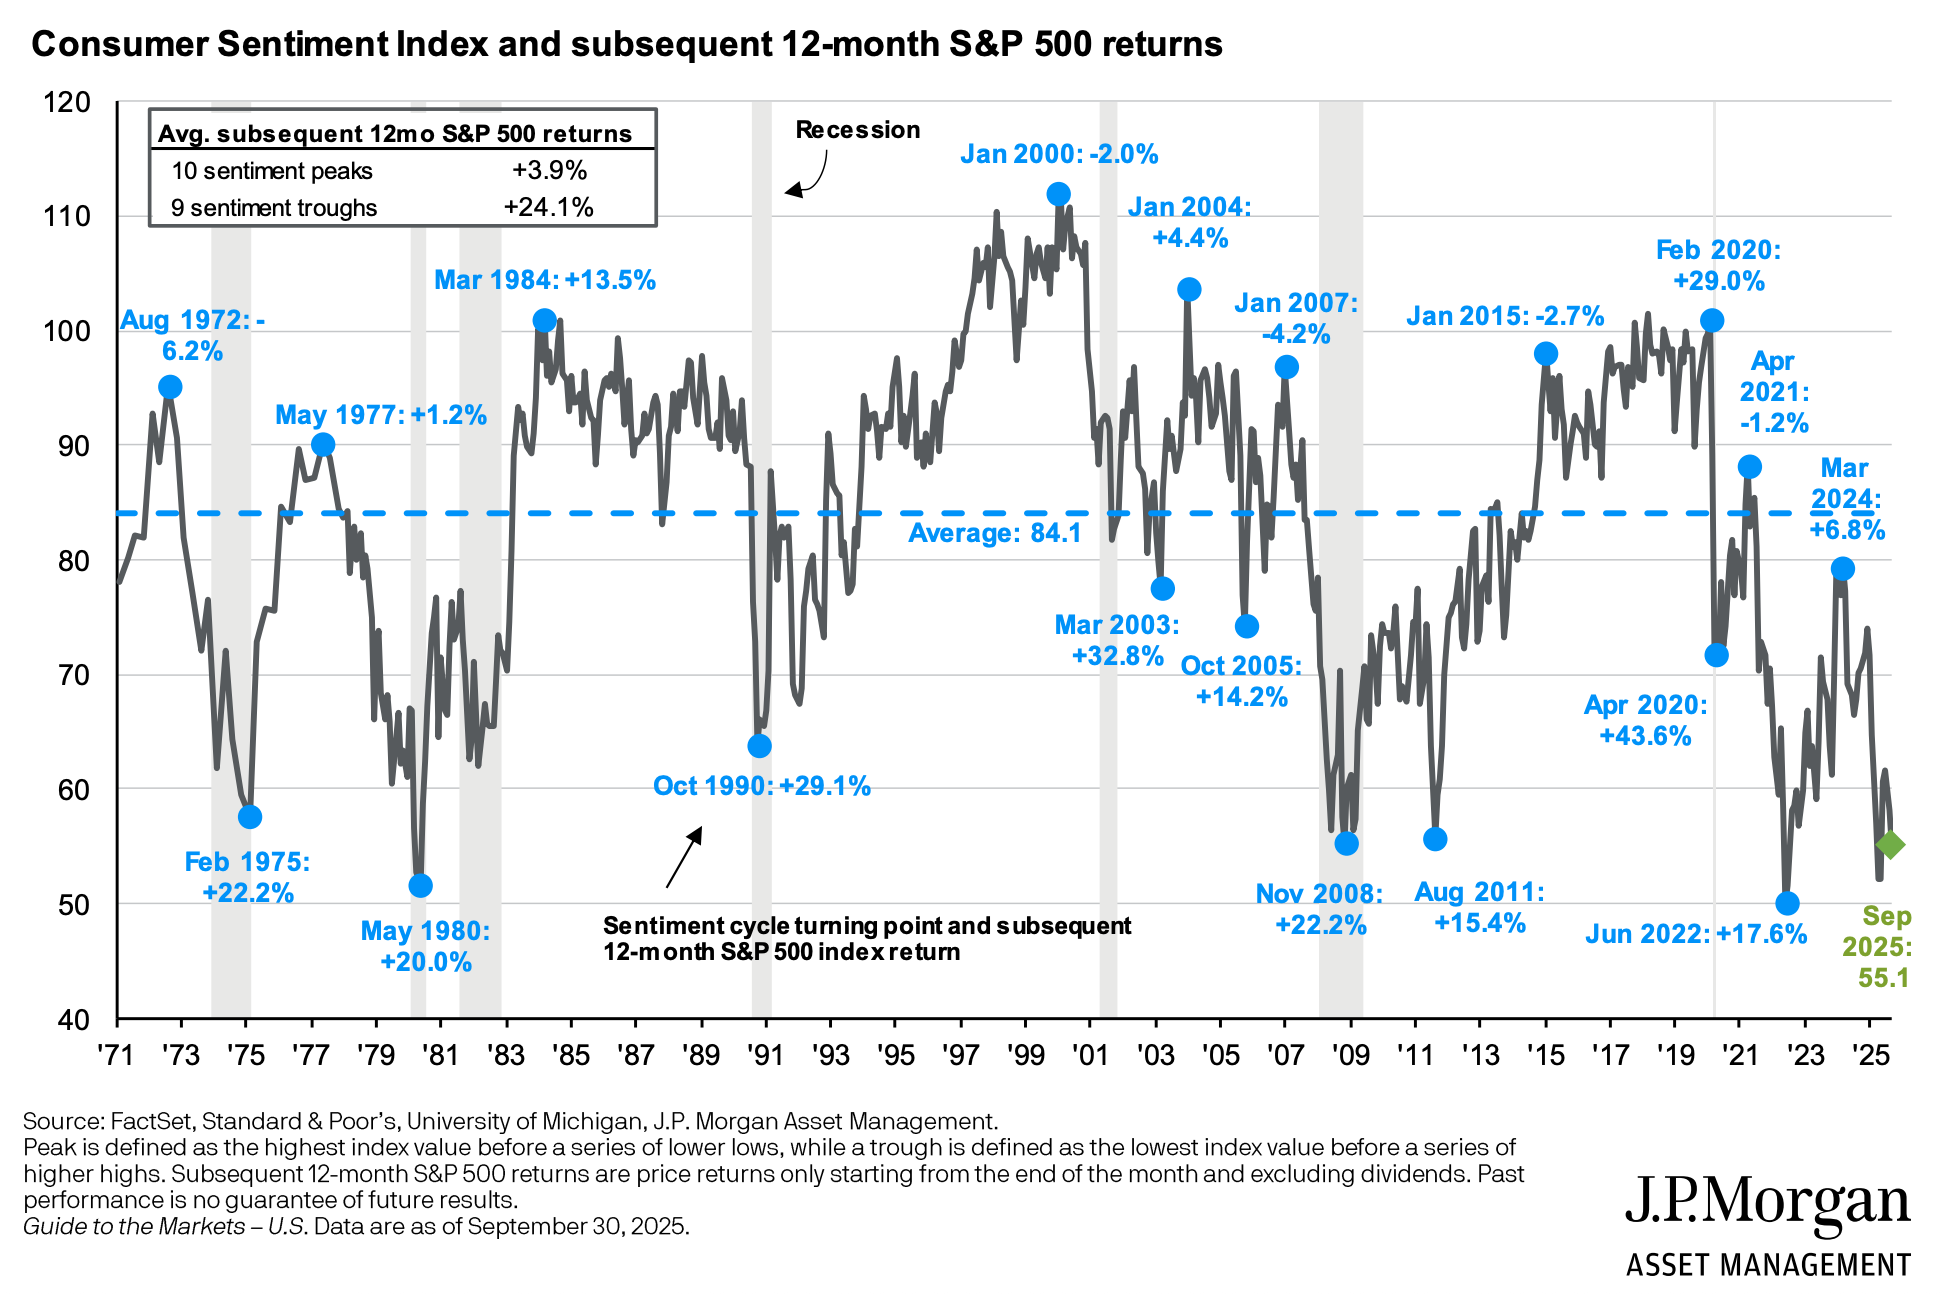
Historically, this objective approach has been a much better guide, even though being a “contrarian” is psychologically difficult and painful when markets ignore fundamentals for years. The correlation between the crowd’s subjective expectations and actual future returns is often negative – the more the crowd believes in high gains, the worse the results tend to be.
On the chart below taken from , you can see investor sentiment and the subsequent 12‑month return of the S&P 500. It clearly shows that the more optimistic the market mood was, the worse the following returns tended to be – and vice versa.
The Trap of Excessive Extrapolation
The problem of extrapolation is particularly visible among equity analysts and individual investors. Analysts consistently forecast earnings growth of 10–20% per year, while the actual growth rate is often roughly half of that. What is more, their forecasts are procyclical – they peak when market valuations are at their highest, precisely when objective indicators are already signalling overvaluation.
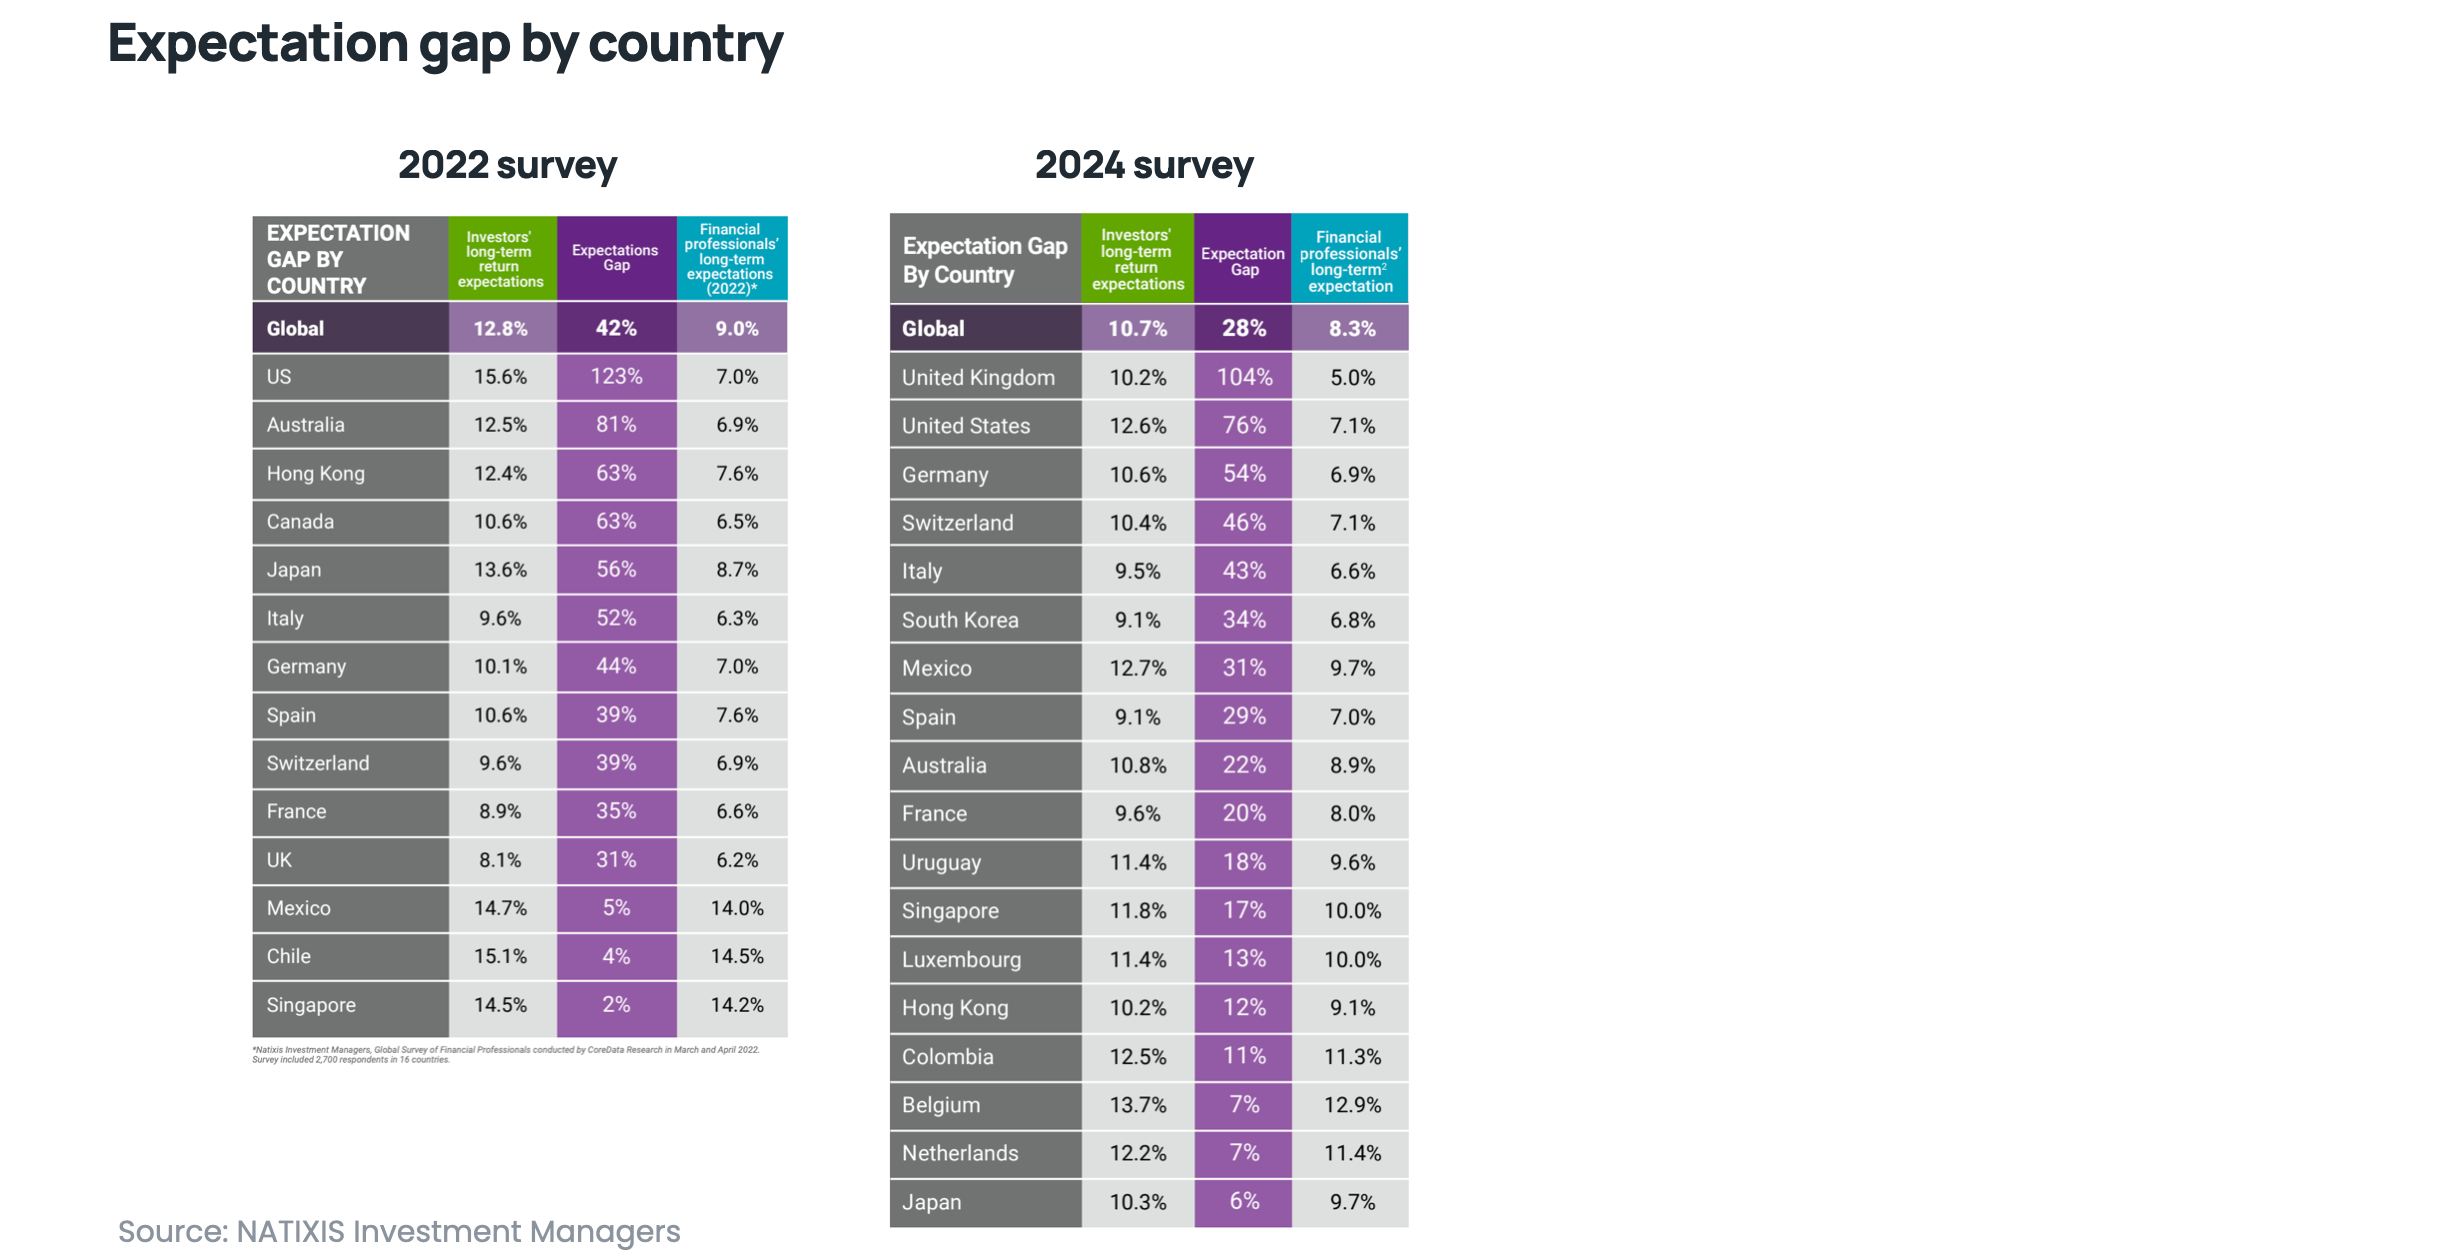
Natixis research for 2024 shows that individual investors expect real long‑term returns of 9–14% per year (right‑hand table), which is very high compared with professional forecasts in the high single digits. Even though the gap in expected returns between professionals and individuals is still large (28 percentage points), it is smaller than in the 2022 survey, when the difference reached as much as 42 percentage points.
The US Market Trap: Will American “Exceptionalism” Last Forever?
The last decade has belonged to the United States. The US equity market has crushed the rest of the world, leading many investors to believe that “only the US matters.” However, a closer look at the sources of this outperformance paints a very different picture.
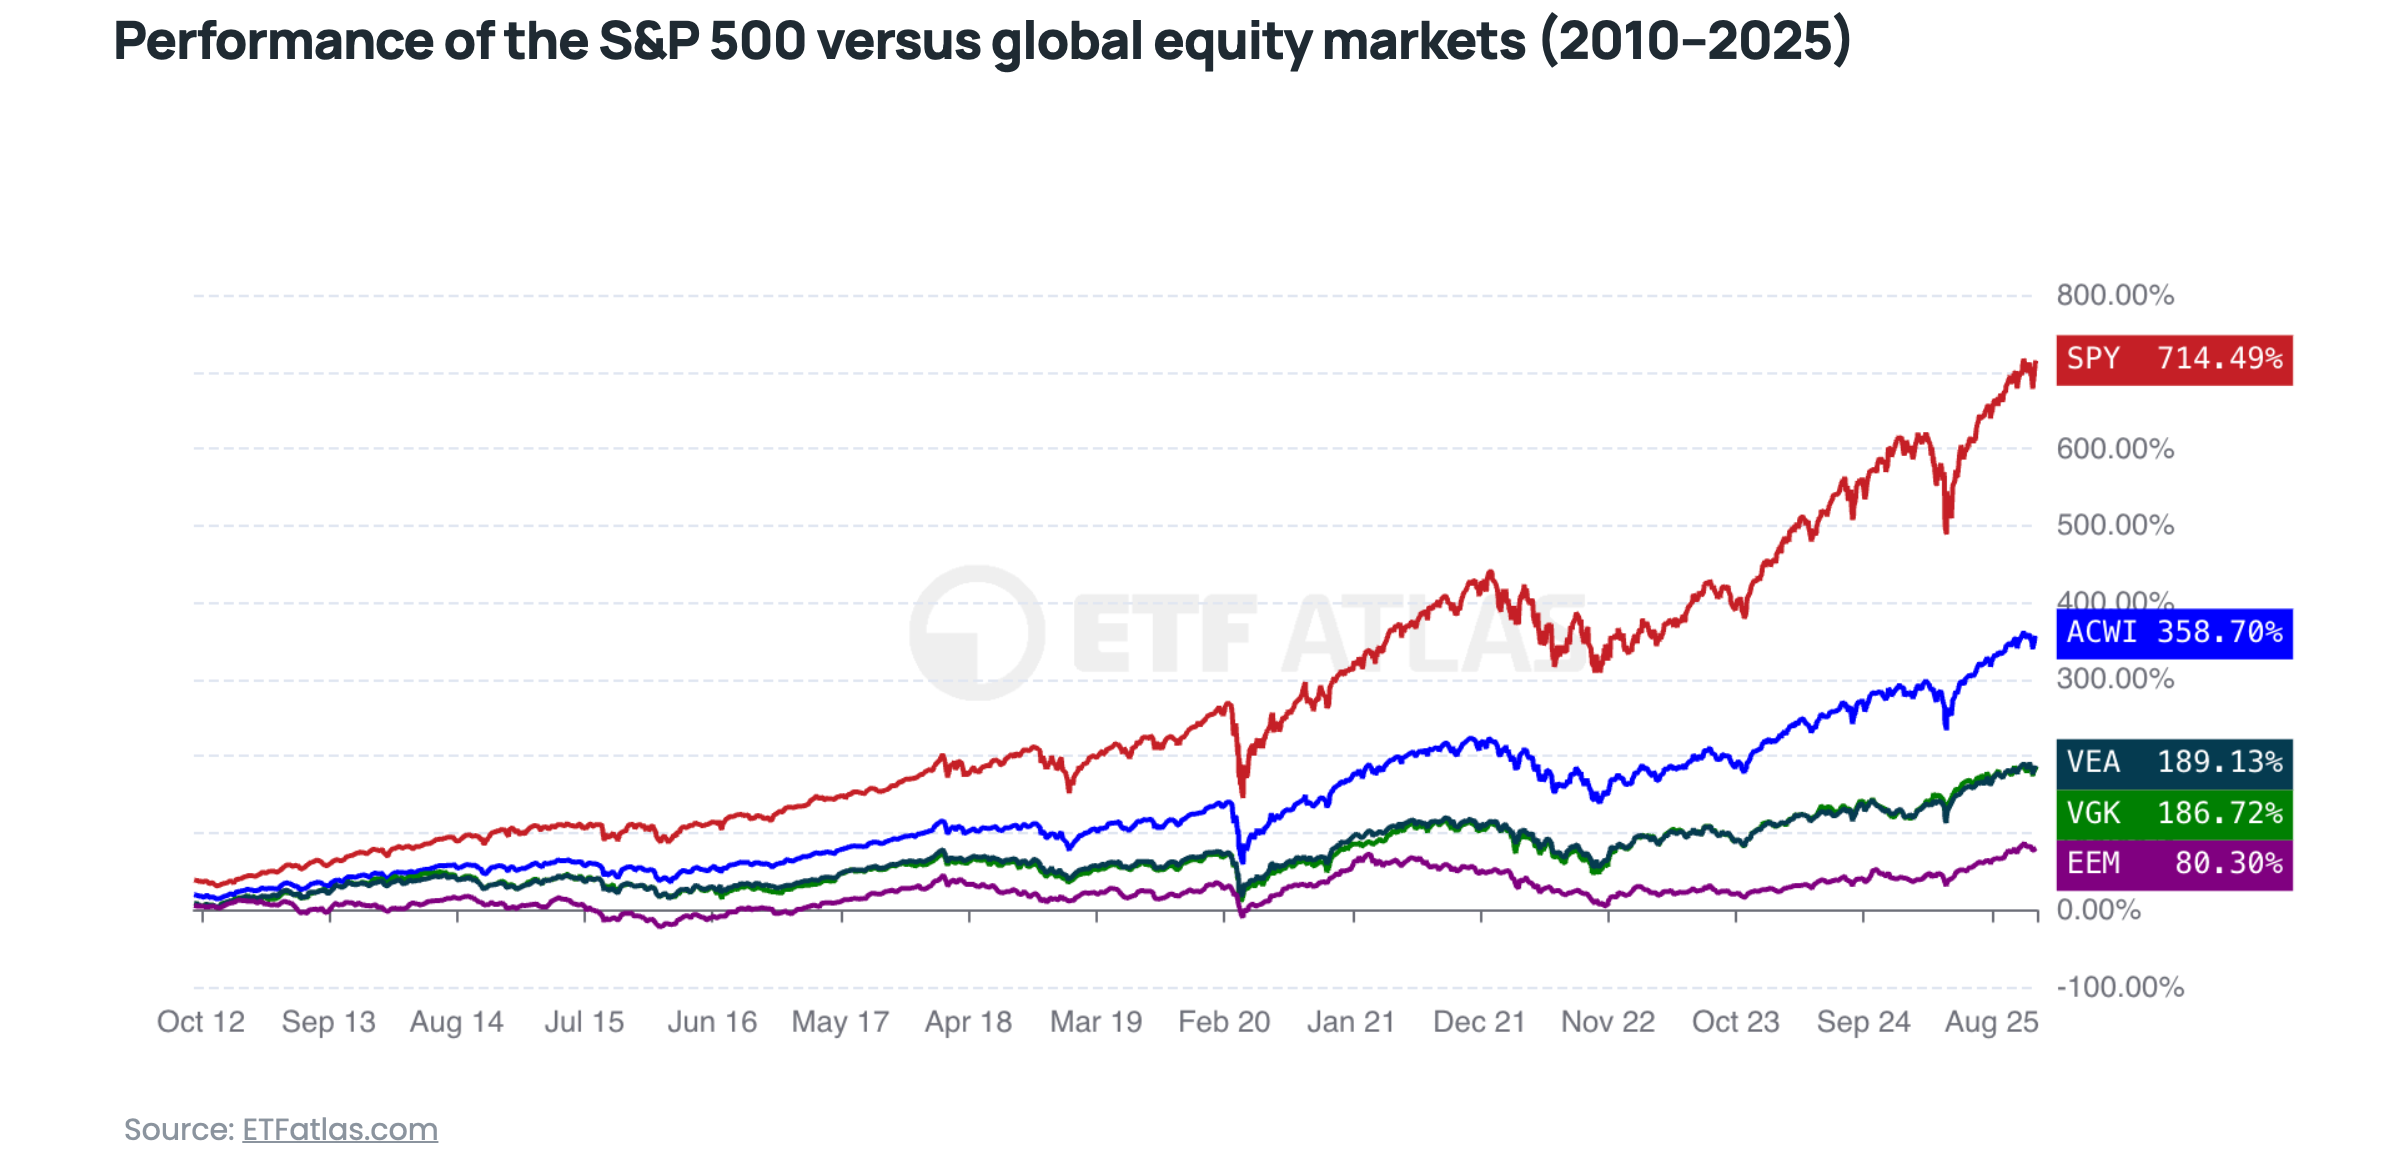
ETF performance from 01.01.2010 to 19.12.2025 illustrates just how dominant the US has been over this period, but also sets the stage for questioning how sustainable this dominance really is.
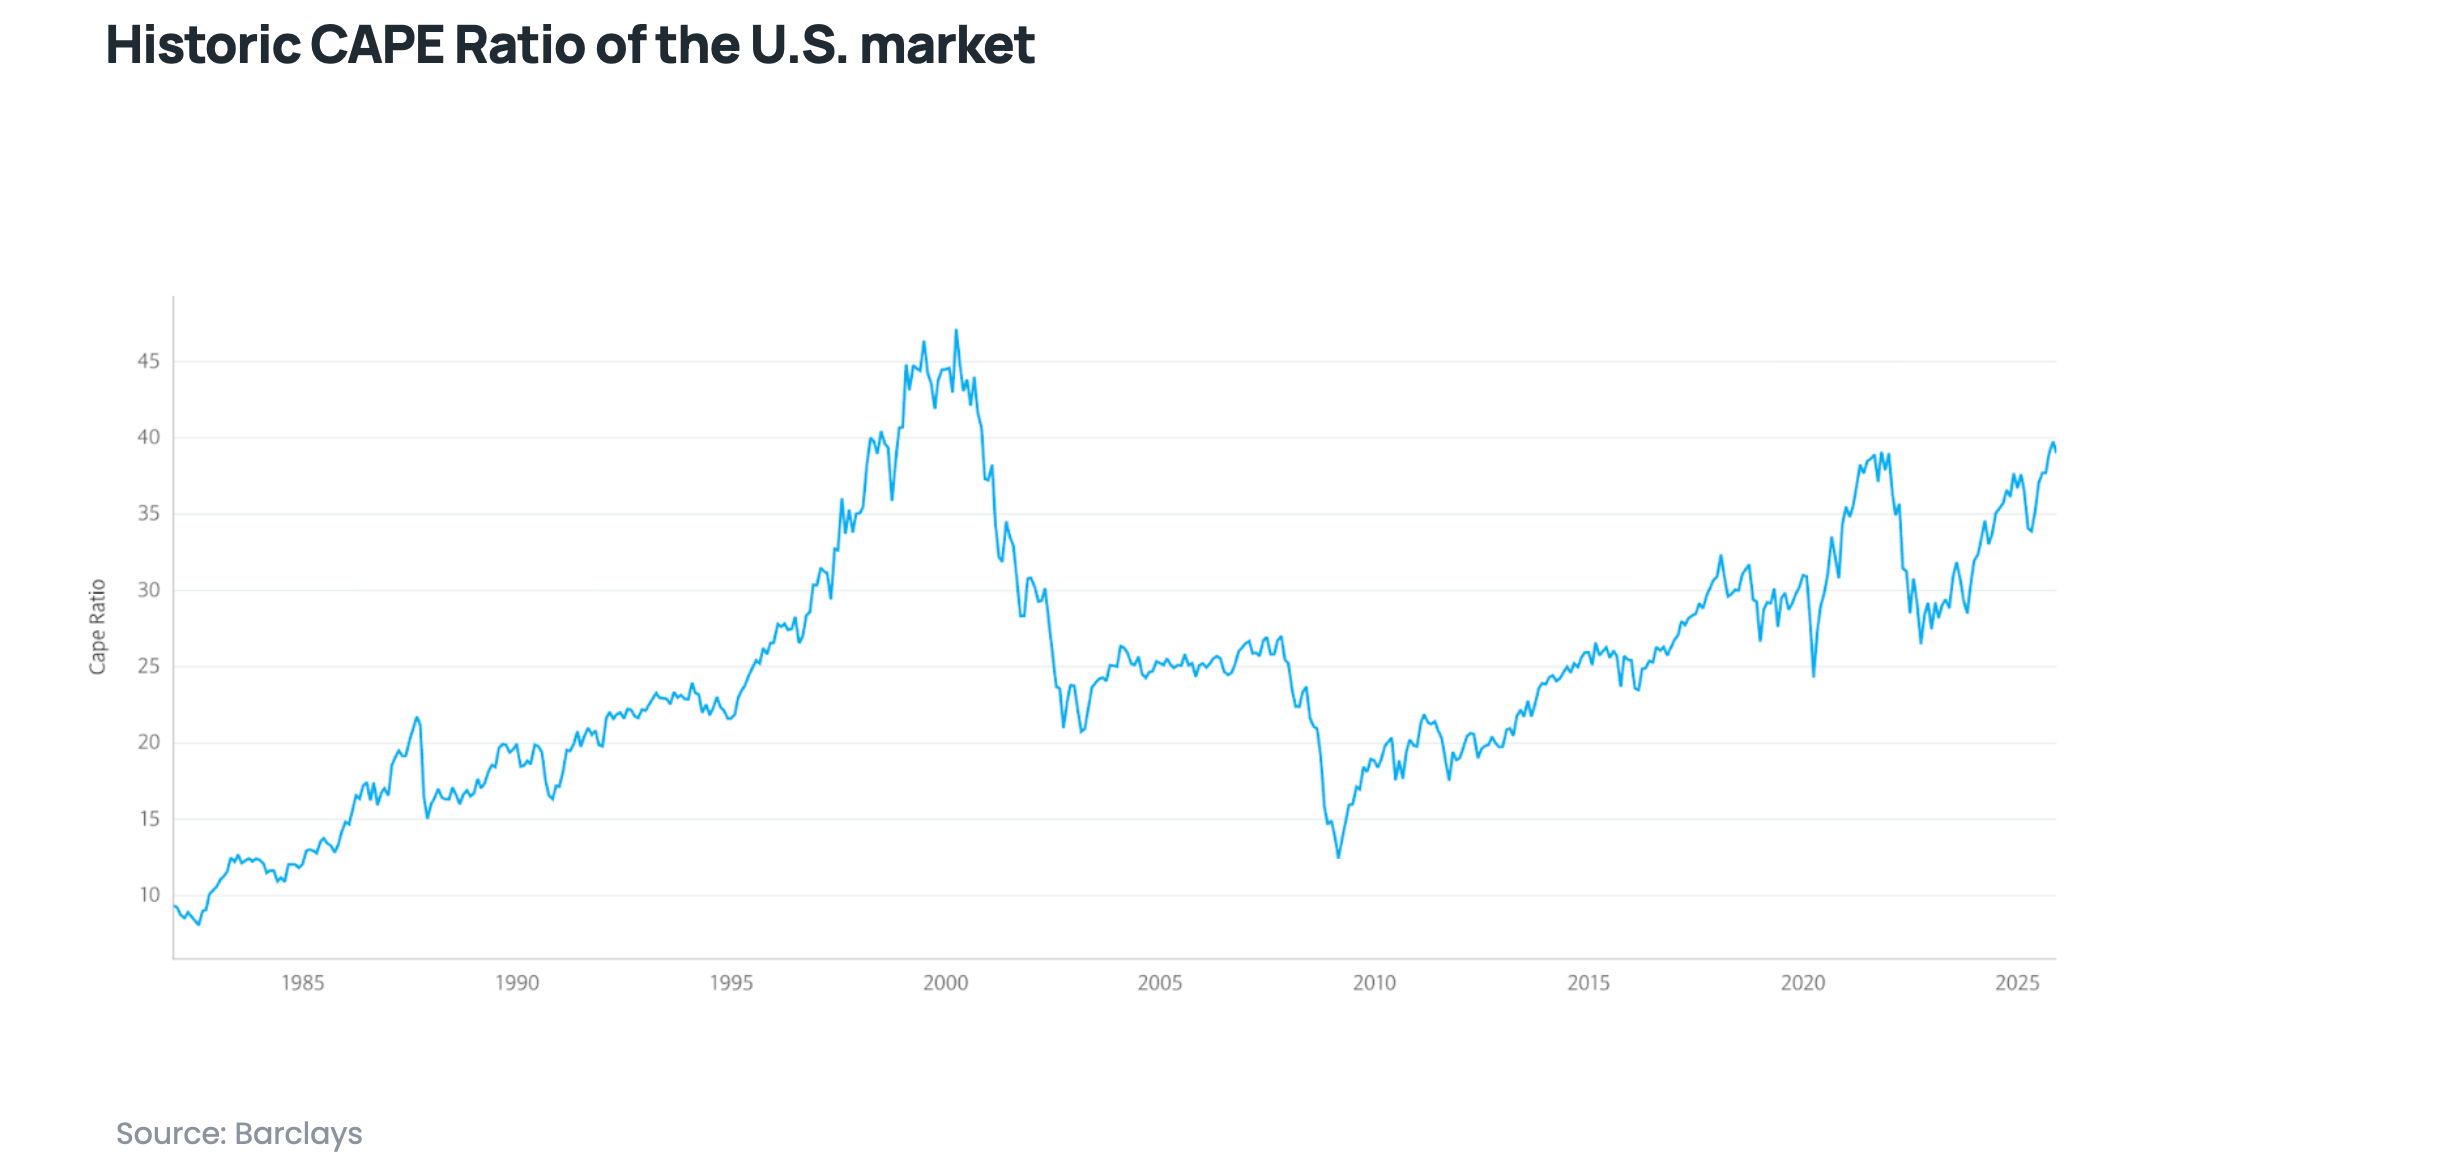
Most of the US market’s excess return over the rest of the world in recent years has not come from fundamentally faster business growth, but from multiple expansion. In other words, investors have simply agreed to pay more and more for each dollar of company earnings. The CAPE (Shiller) ratio has risen from a historical average of around 17x to roughly 40x – levels previously seen only during the dot‑com bubble.
Are US companies really growing faster? An analysis of the components of earnings‑per‑share (EPS) growth in the S&P 500 reveals an interesting pattern. Data from J.P. Morgan Asset Management show that EPS growth in 2025 (10.1%) is notably higher than the long‑term average from 2001–2024 (7.3%), but the sources of this growth have changed fundamentally.
Revenue growth has remained stable – in fact slightly lower than historically (4.6% vs. 4.9%). Profit margins have more than doubled (6.3% vs. 2.2%), driven mainly by the technology sector and cuts to corporate tax rates, while share buybacks have been roughly four times more aggressive than in the past (‑0.8% vs. 0.2%), artificially boosting EPS without a corresponding increase in underlying business profits.
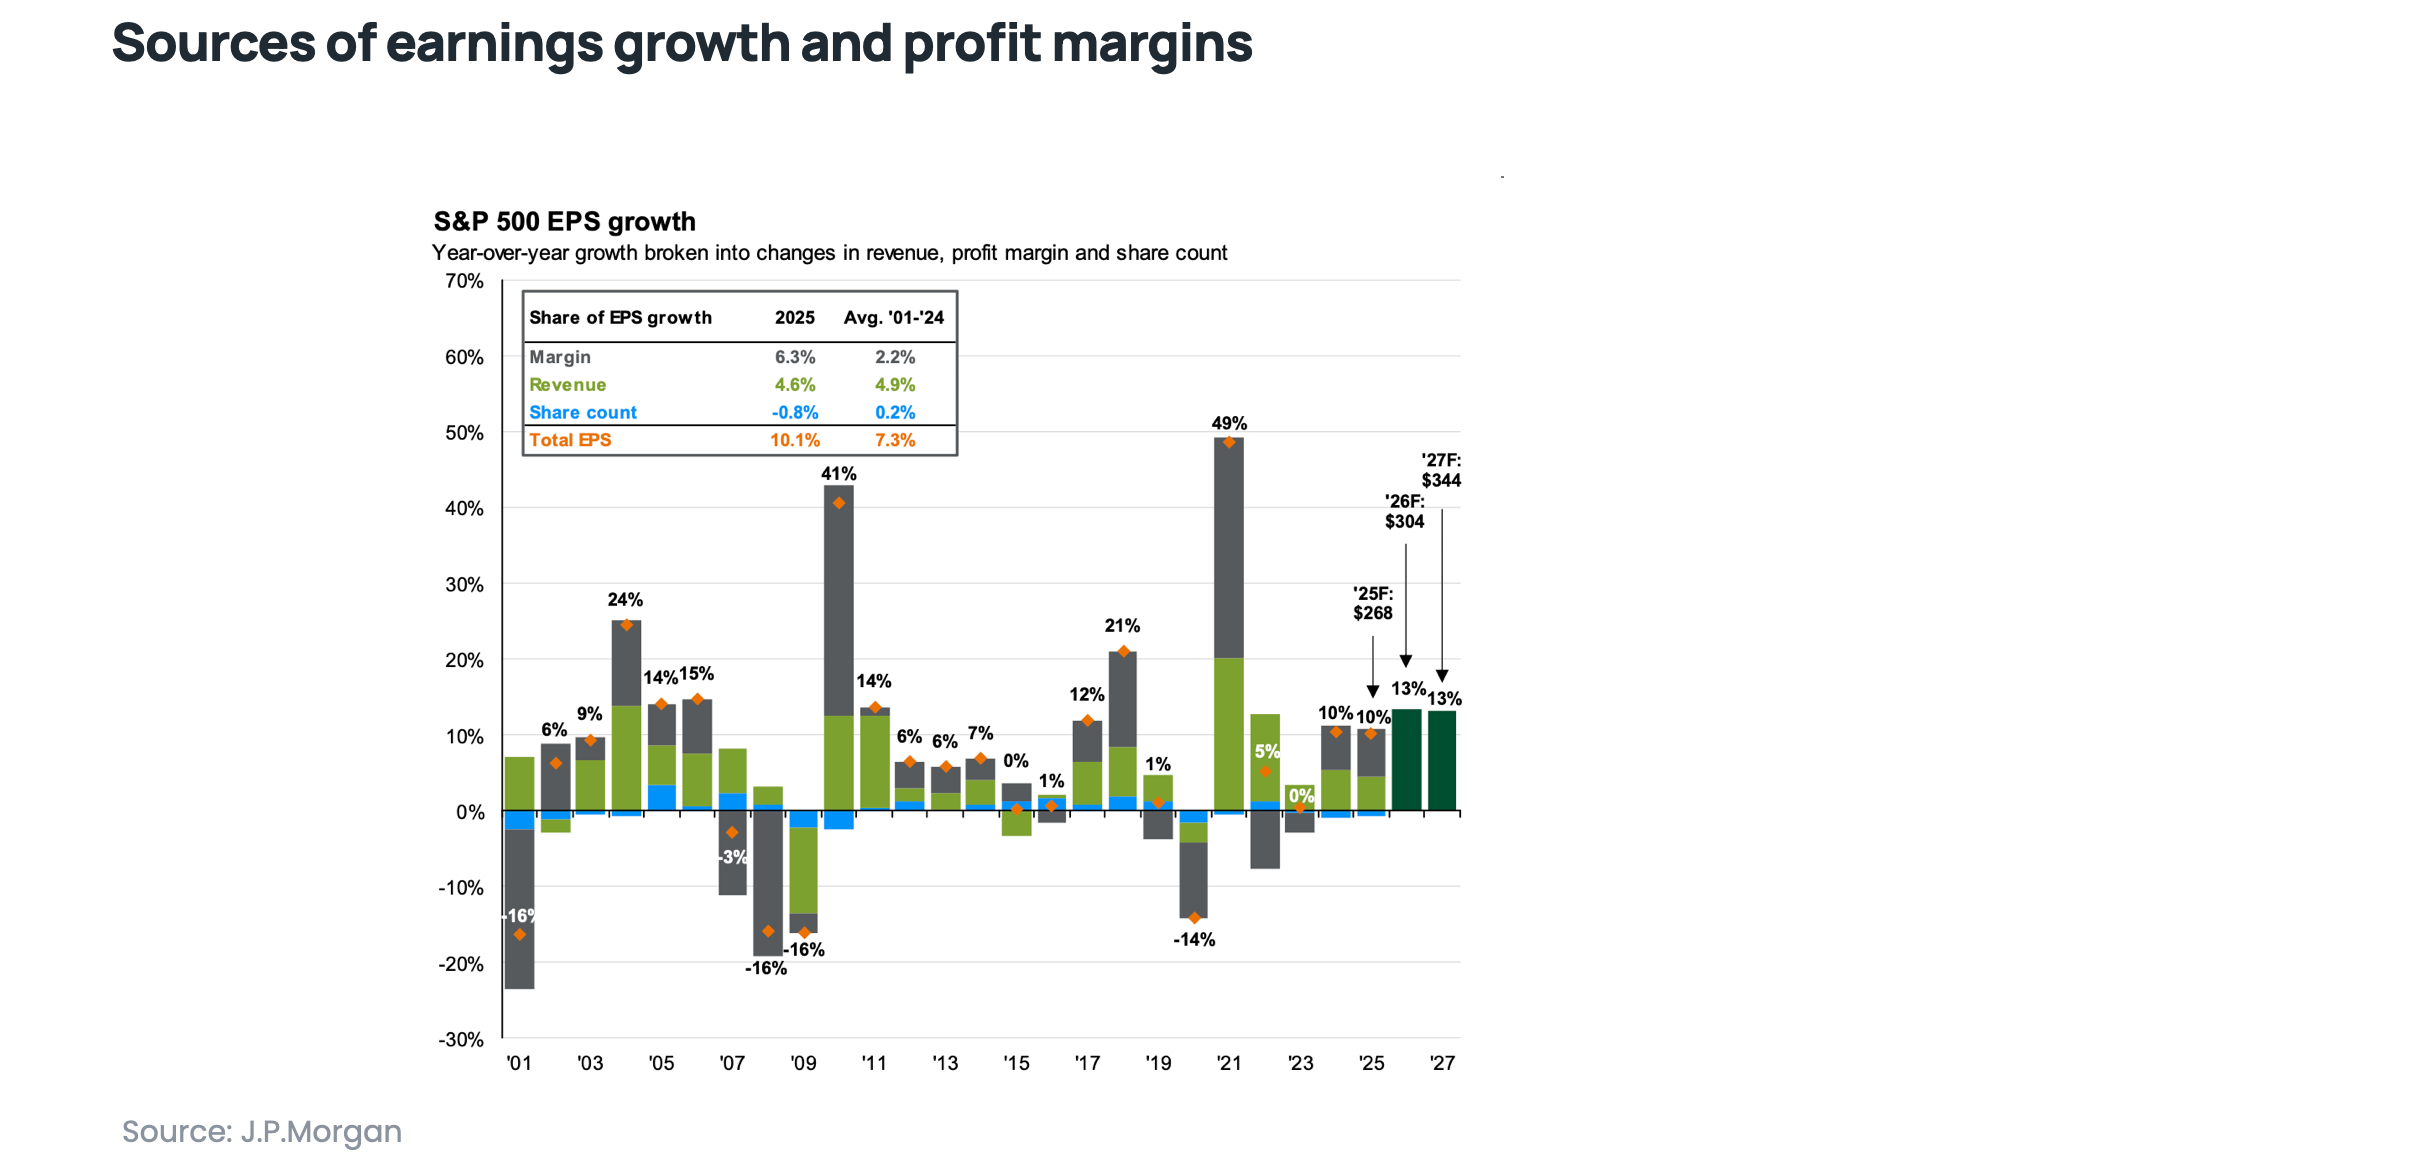
Most of the “excess” EPS growth comes from much higher profit margins (driven mainly by the technology sector) and aggressive share buybacks. Revenue growth remains in line with its historical pace, which means companies are not actually growing faster – they are simply earning more on each dollar of sales.
Extrapolating this trend indefinitely is dangerous. Profit margins cannot expand forever, and buybacks face hard capital constraints. Assuming that technological leadership and the “exceptionalism” of the US will last forever increasingly resembles the mood of the late 1990s, when CAPE peaked at 44.2x just before the crash.
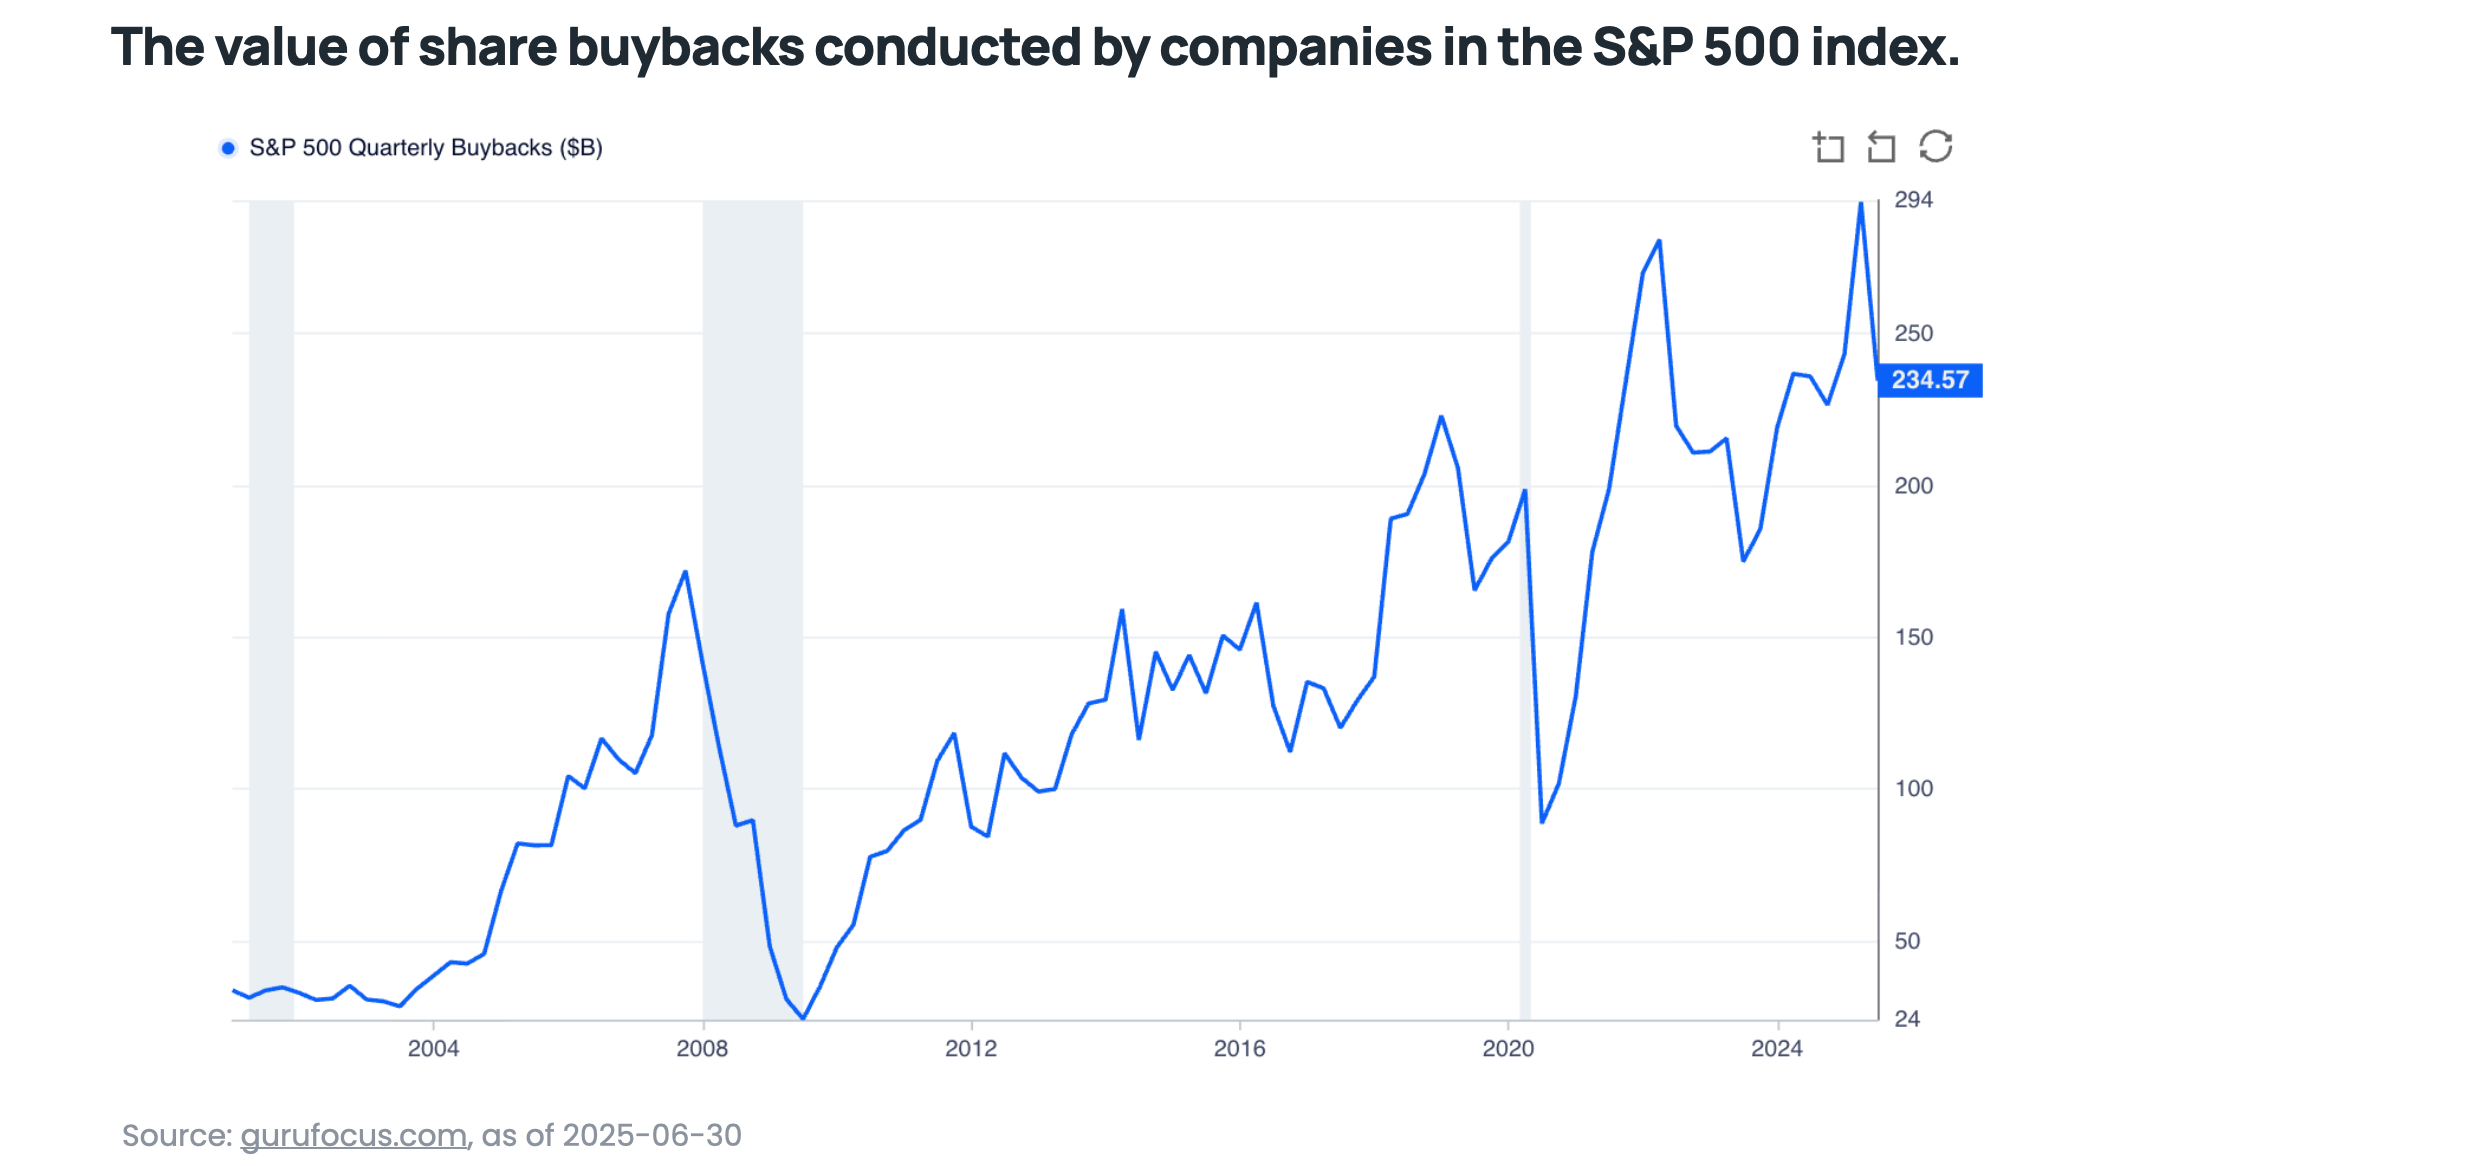
The chart above shows quarterly share buybacks conducted by S&P 500 companies, expressed in billions of US dollars. Companies tend to spend enormous amounts on repurchasing their own shares at the peak of the market cycle, when stocks are expensive and cash piles are large – as in 2007. When recession hits (like in 2008–2009), they have less cash and cut buybacks, even though lower prices would actually make it the best time to buy back shares.
The takeaway? Even though the US is home to many great businesses, as a market it is currently very expensive. Geographic diversification, which has been mocked throughout the last decade, may well be a key ingredient of investment success in the years ahead.
Alternatives and Portfolio Complexity
In the search for returns in a challenging environment, many investors turn to alternative investments such as private equity, private debt or real estate. In fact, when it comes to property, you do not even need a difficult environment in Poland – real estate is a national sport here, quite unlike stock market investing, and this is exactly where the illusion trap lies.
Private equity (PE) is a form of equity investing that allocates capital to non‑public companies that are not listed on an exchange. The apparent “stability” of illiquid assets like private equity often stems purely from the fact that they are not priced daily by the market – a phenomenon known as volatility smoothing. If they were valued realistically, their risk would often be similar to equities and the diversification benefits smaller than they seem.
Private debt (also called private credit) is a form of investing where funds and private investors lend money to companies instead of traditional banks or public bond markets. True diversification can come from liquid alternatives that genuinely have low or negative correlation to equities (for example, managed futures), but they carry behavioural risks: they are complex, and individual investors often abandon them at the worst possible moment (for instance, after a year of weak performance), forfeiting the benefits of a long‑term strategy.
The rule is simple: if you do not understand a strategy and are not prepared to stick with it through difficult periods, you should not invest in it. Portfolio complexity is a double‑edged sword.
Summary and Takeaways for Your Portfolio
An analysis of objective market data leads to clear – if not always popular – conclusions for the coming years.
Reject the rear‑view mirror. The fact that the US market and tech stocks dominated the last decade does not mean they will dominate the next; history shows that market leaders change over time.
Lower your expectations. At today’s valuations, rational expectations for US equities are around 3% real per year (after inflation), not the 10–15% annualised returns investors grew used to during the bull market.
Diversify globally. International markets are much cheaper and offer higher return potential purely due to starting valuations – do not bet everything on a single card (the USA).
Appreciate bonds. After a painful sell‑off, bonds once again offer sensible real yields and can genuinely help to protect a portfolio.
Be patient. Objective indicators work over the long term; in the short term, the market can stay irrational longer than you expect, so do not fight the market – but also do not get swept up in its euphoria.
Investing is a marathon, not a sprint. Rely on cool, data‑driven analysis instead of chasing hot trends, and your portfolio will thank you over the next 10 years.