Every generation believes they’re living through unprecedented times. Current geopolitical tensions, technological disruption, and market volatility feel uniquely challenging. But history reveals a surprising truth: while headlines change, human behavior—and market responses—remain remarkably consistent.
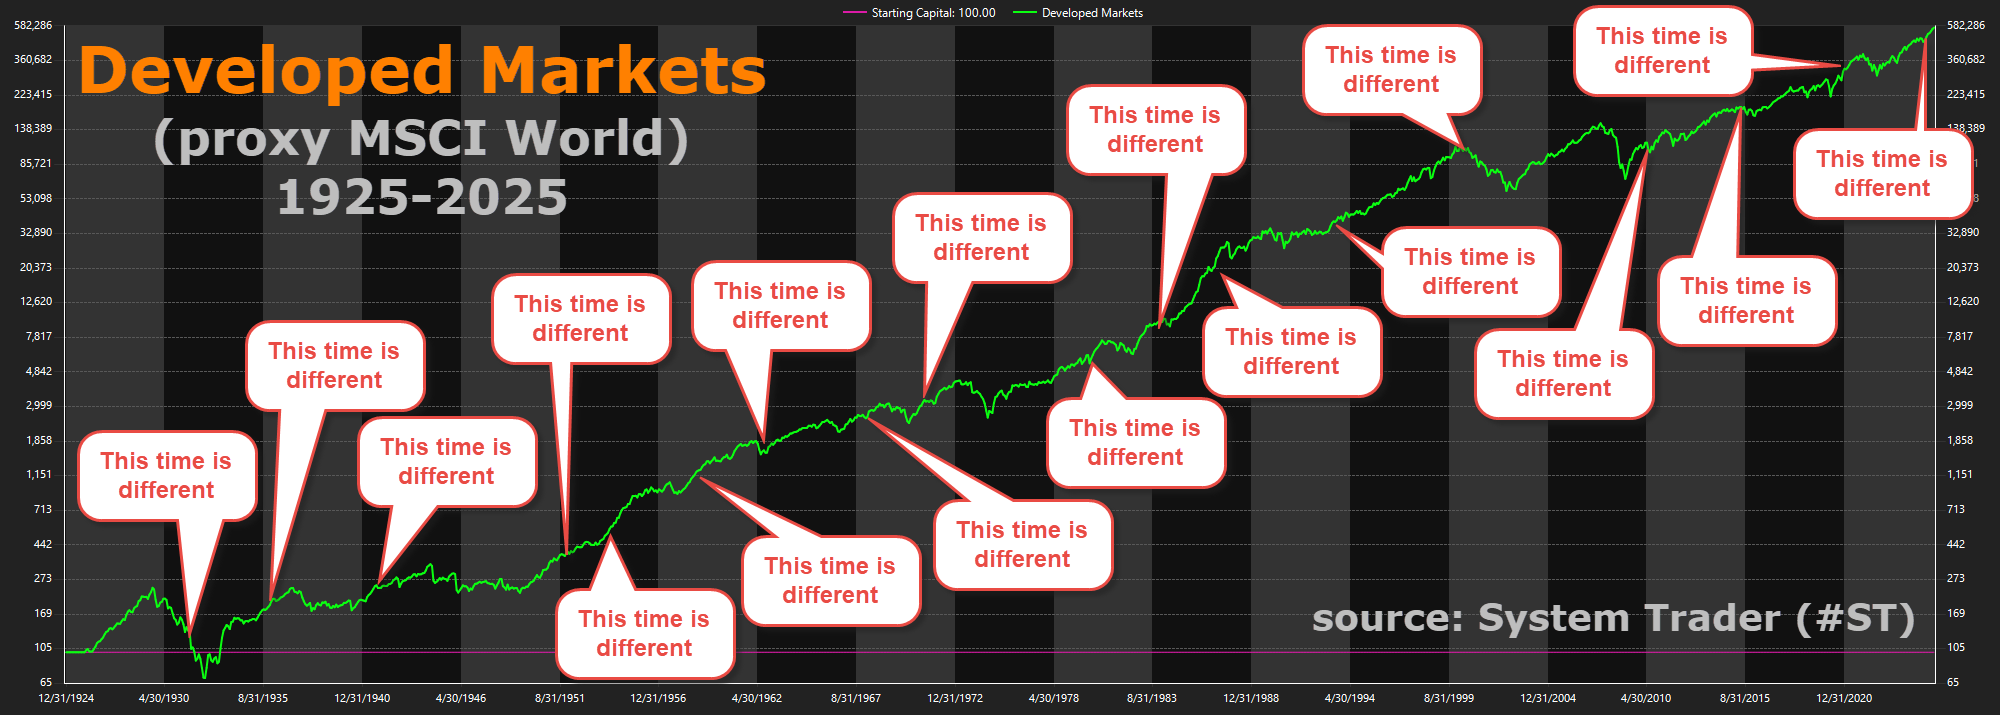
The chart showing $100 invested in developed markets (MSCI World equivalent) from January 1925 to November 2025 tells a compelling story. Despite a century of wars, depressions, and crises, that investment delivered a compound annual growth rate (CAGR) of 8.9%, with real returns (after inflation) of approximately 5.7%. Even with a maximum drawdown of -71%, the upward trajectory demonstrates the market’s fundamental tendency to rise over time.
The Paralysis of Perfect Timing
Beginning investors face a particular challenge: the fear of entering the market at precisely the wrong moment. This anxiety stems from a cognitive bias—we perceive our current moment as exceptional. Yet markets spend most of their time rising, not falling. The S&P 500 delivered 10.5% annually from 1925 through 2025, or approximately 7.4% after inflation. Attempting to predict the exact day before a major downturn isn’t just difficult—it’s nearly impossible.
The mechanism behind this resilience is straightforward: investing involves uncertainty and discomfort. Because most people avoid these feelings, those who embrace them are compensated through risk premiums. Without volatility and uncertainty, there would be no excess returns to harvest.
Historical Crises: When “This Time is Different” Proved Wrong
- The Great Depression (1929-1932): The developed markets basket delivered a CAGR of approximately -17% during this period. Deflation averaged around 6.4% annually during 1930-1933, meaning the real (purchasing power-adjusted) loss was approximately -12% per year. Over four years, capital’s purchasing power shrank roughly 40%—a devastating result. By 1933, unemployment reached 25%, and 9,000 of 25,000 banks had failed. Yet markets eventually recovered and reached new highs.
- World War II (1939-1945): Contrary to expectations, the global stock basket achieved a CAGR of 5.7%, or 1.8% after accounting for approximately 4% annual inflation during this period. The U.S. market climbed approximately 10% on September 5, 1939, the first trading day after Germany invaded Poland. Despite Pearl Harbor’s brief 2.9% impact, the Dow ultimately rose 50% from 1939 to 1945, representing over 7% annual gains.
- The 1970s Stagflation Crisis: Between January 1973 and December 1974, the Dow lost over 45% of its value. With inflation averaging 7-10% annually through the decade, the S&P 500 lost nearly 50% in real, inflation-adjusted terms during the 1970s. Yet this “lost decade” gave way to the powerful bull market of the 1980s and 1990s.
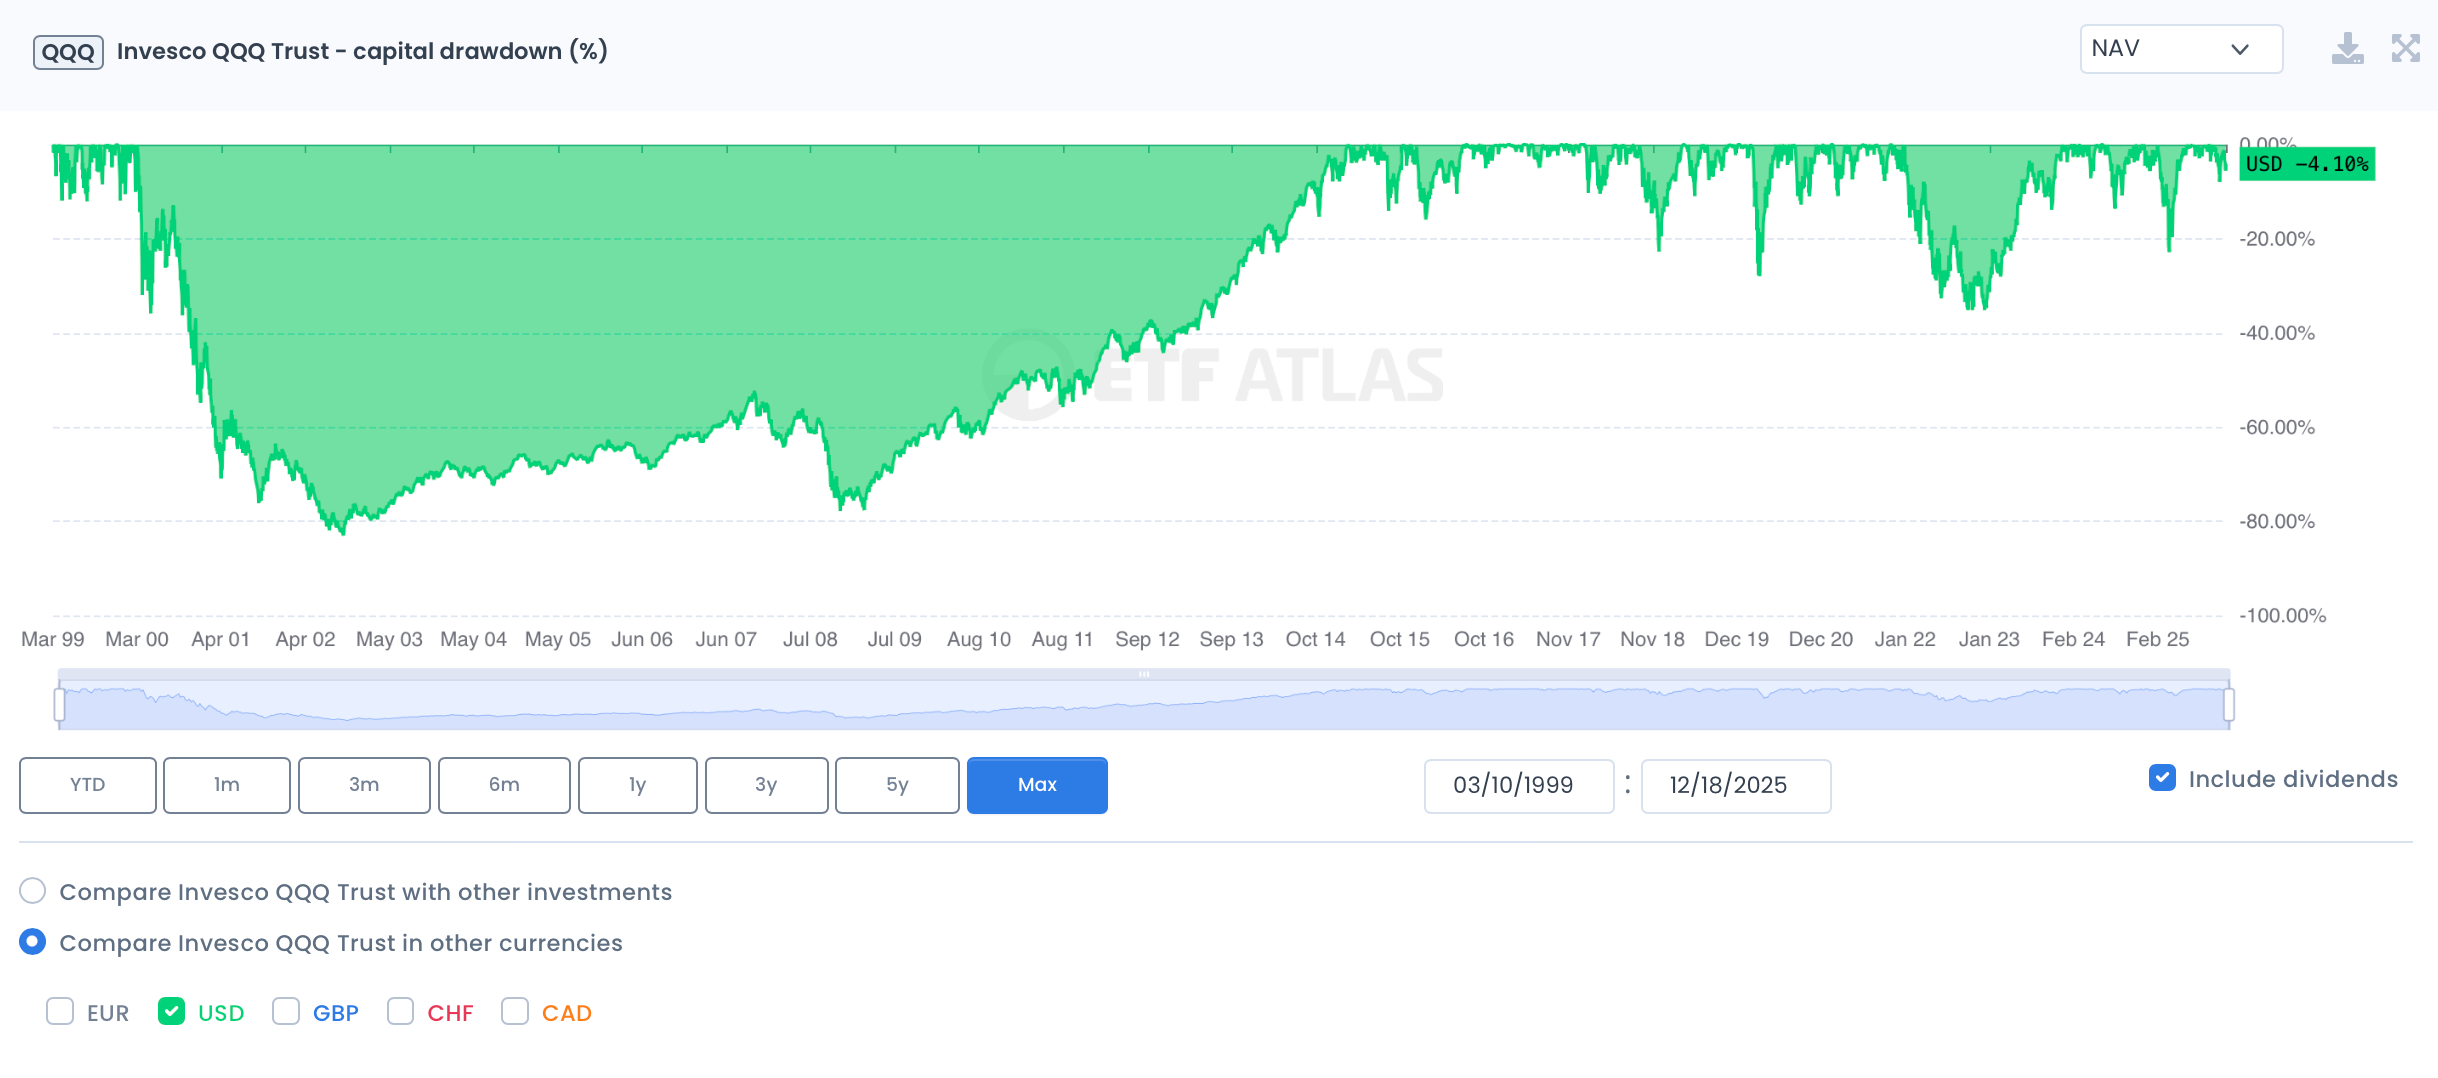
- The Dot-Com Bubble (2000-2002): The NASDAQ-100 plummeted 83% from its March 2000—a devastating decline. The index took 15 years to recover to its previous peak. Yet survivors like Amazon that endured emerged as global giants.
- The Global Financial Crisis (2007-2009): Tthe S&P 500 lost approximately 57%. Yet by year-end 2009, the S&P 500 had already rebounded over 65% from its low.
In each case, investors were convinced the crisis was fundamentally different. And in specific details, they were right. But in outcomes, they were wrong—markets recovered and exceeded previous highs.
The Last 25 Years: A Real-World Stress Test
The period from 2000 to 2024 provides a particularly instructive example. This quarter-century included the Dot-Com Bubble, the Global Financial Crisis, COVID-19, the war in Ukraine, and numerous other shocks. For the global developed markets stock basket (MSCI World equivalent), the CAGR was approximately 5%, or 2.4% after inflation.
The mathematics are revealing: $100 invested in developed market stocks nominally grew to $340, or $180 in real purchasing-power terms. Meanwhile, $100 held in cash, though still nominally $100, retained only $53 of purchasing power due to cumulative inflation of approximately 88% over this period. By avoiding market risk entirely, cash holders accepted a guaranteed 47% loss of purchasing power.
Alternative Diversification Strategies
The observation that globally diversified stock portfolios can decline 60-70% doesn’t mean investors must accept this volatility. Traditional diversification has long relied on the “60/40” model to smooth out returns. For example, a portfolio allocated 60% to developed market stocks and 40% to 10-year U.S. government bonds over the last century (1925–2025) would have delivered a compound annual growth rate (CAGR) of approximately 4,6% (in real terms), with a maximum drawdown of 50%. While this drawdown is less severe than the ~71% drop seen in pure equities, a loss of half one’s portfolio value is still psychologically difficult for many to endure.
This is where alternative strategies like managed futures can play a vital role. Adding a 20% managed futures allocation to a traditional 50/30 stock/bond mix has historically reduced maximum drawdowns to approximately 40% and increased CAGR to 6% (in real terms).
The lesson: viewing portfolios holistically, rather than focusing exclusively on individual components, leads to more robust strategies. A well-diversified portfolio using multiple asset classes can significantly reduce volatility while maintaining acceptable long-term returns.
The Discipline Required
Understanding that markets recover intellectually differs from maintaining conviction during a crisis. When account balances decline 30% or 50%, the psychological pressure to “do something” becomes intense. Media amplifies this stress—sensational headlines generate higher viewership than calm analysis.
A written investment plan becomes essential. It should specify asset allocation targets, rebalancing rules, contribution schedules independent of market conditions, and criteria for making changes that aren’t emotion-based. During turbulence, the plan provides a rational framework for decision-making.
ETFs offer excellent tools for implementing such plans—they provide instant diversification across hundreds or thousands of securities, low costs, transparency, and ease of trading.
This Time Is Different—But Also the Same
Yes, today’s challenges are unprecedented in their specific manifestations. Artificial intelligence, climate change, and geopolitical realignments create uncertainties previous generations never faced. In this sense, “this time is different.”
But in ways that truly matter for long-term investors, this time is remarkably similar. Markets still reflect the collective hopes, fears, and uncertainties of millions of participants. Uncertainty still creates discomfort. That discomfort still deters many from investing. And consequently, those who maintain discipline through volatility are still compensated for bearing that risk.
The chart of $100 growing from 1925 to 2025 isn’t merely historical curiosity—it’s a roadmap. It shows that while the journey involves significant turbulence, the destination has consistently rewarded patient, diversified, disciplined investors. The question isn’t whether markets will experience future crises—they will. The question is whether you’ll maintain your plan when they do.
Because while this time may feel different, the fundamental dynamics that drive long-term investment success remain unchanged. Markets reward patience, penalize panic, and ultimately trend upward over extended periods.