In investing, people often talk about the famous S&P 500 index, which is one of the main reference points in financial markets. Large investment trusts, funds and individual investors compare their results to this index. Why? Because for decades, the S&P 500 has shown the state of the biggest economy in the world, bringing together the 500 largest companies traded on the American stock market.
But there is a paradox: even if someone builds a very well-diversified and carefully planned portfolio, at many points in time, the results can still be worse than simply investing in the S&P 500. This happens because of how markets work, the ups and downs in the world economy, and the way people behave as investors. This article will look at why this happens, how you should look at it, and what a smart investor can learn from it.
What does “losing to the S&P 500” actually mean?
“Losing” to the S&P 500 means that the return from an investor’s portfolio is lower than the return of the index itself. Sometimes the difference is small, but over many years it can make a big difference to whether you do better than simply following the market.
For example:
- In 2021, the S&P 500 rose by around 27%.
- At the same time, many active investment strategies had worse results.
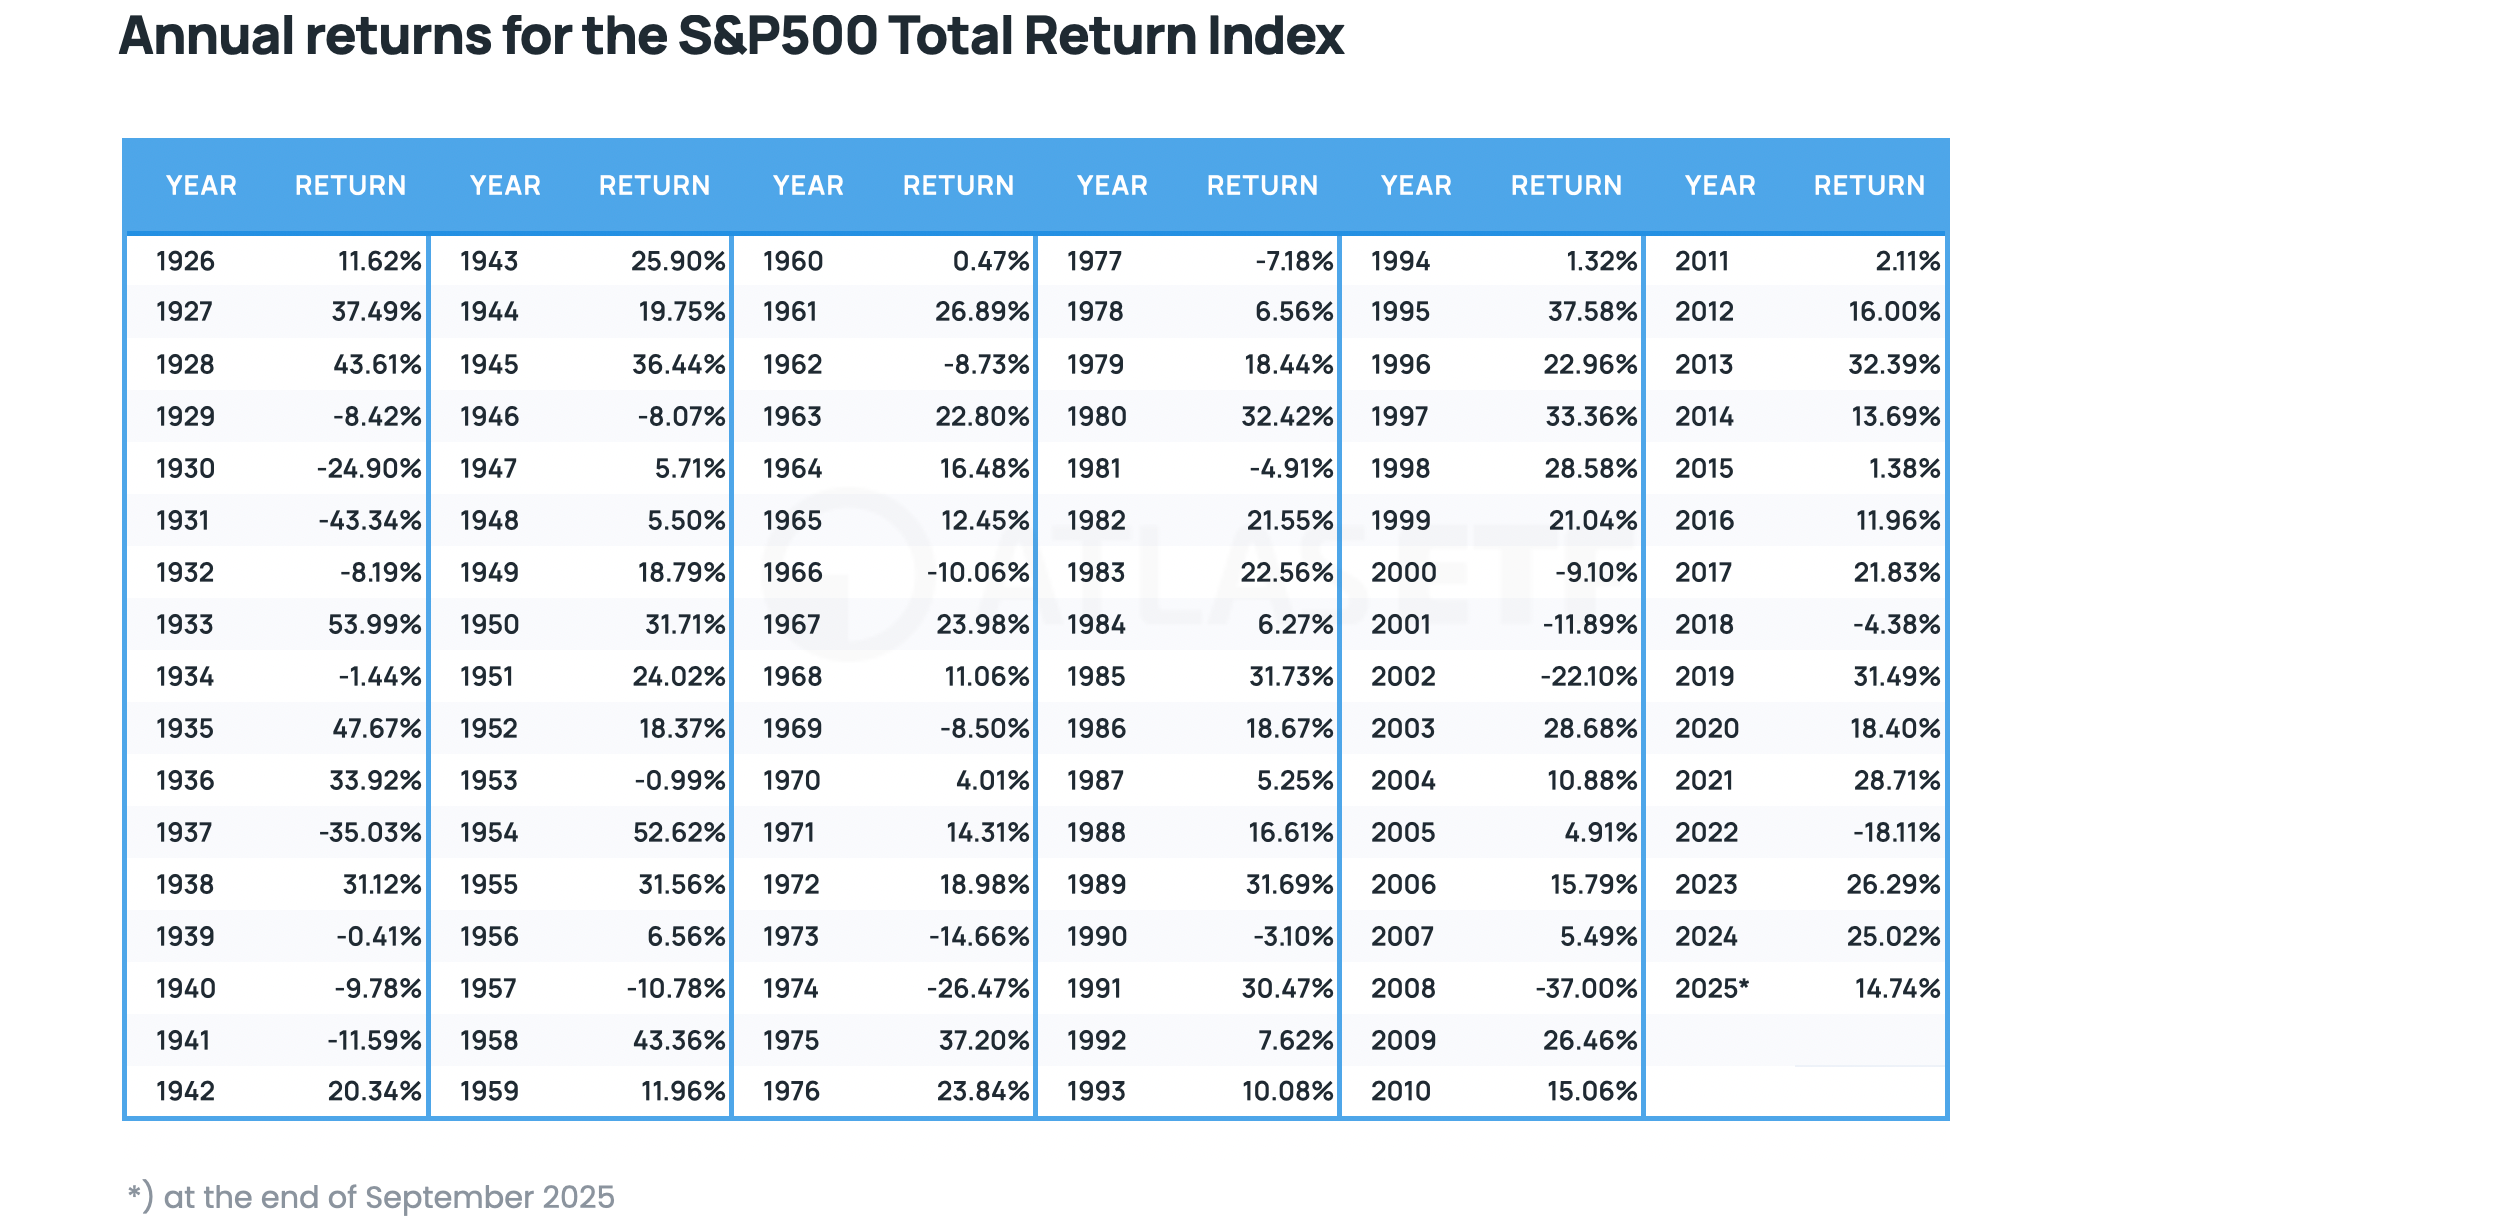
So, someone who “tried to outsmart the market” – buying bonds, defensive shares or even raw materials – might end up disappointed, seeing a simple S&P 500 ETF beating their portfolio. Below is a table of annual returns for the S&P 500 Total Return index.
Why do even the best portfolios sometimes lose?
1. Market cycles
Stock markets work in economic and industrial cycles. There are times when technology companies do best (for example, between 2010 and 2021), but there are also periods when energy, raw materials, or dividend-paying companies perform better. Diversified portfolios try to have a bit of everything, while the S&P 500 in recent years has been driven by ‘’Big Tech’’.
The result? A widely diversified portfolio, which might include bonds or defensive sectors, can fall behind.
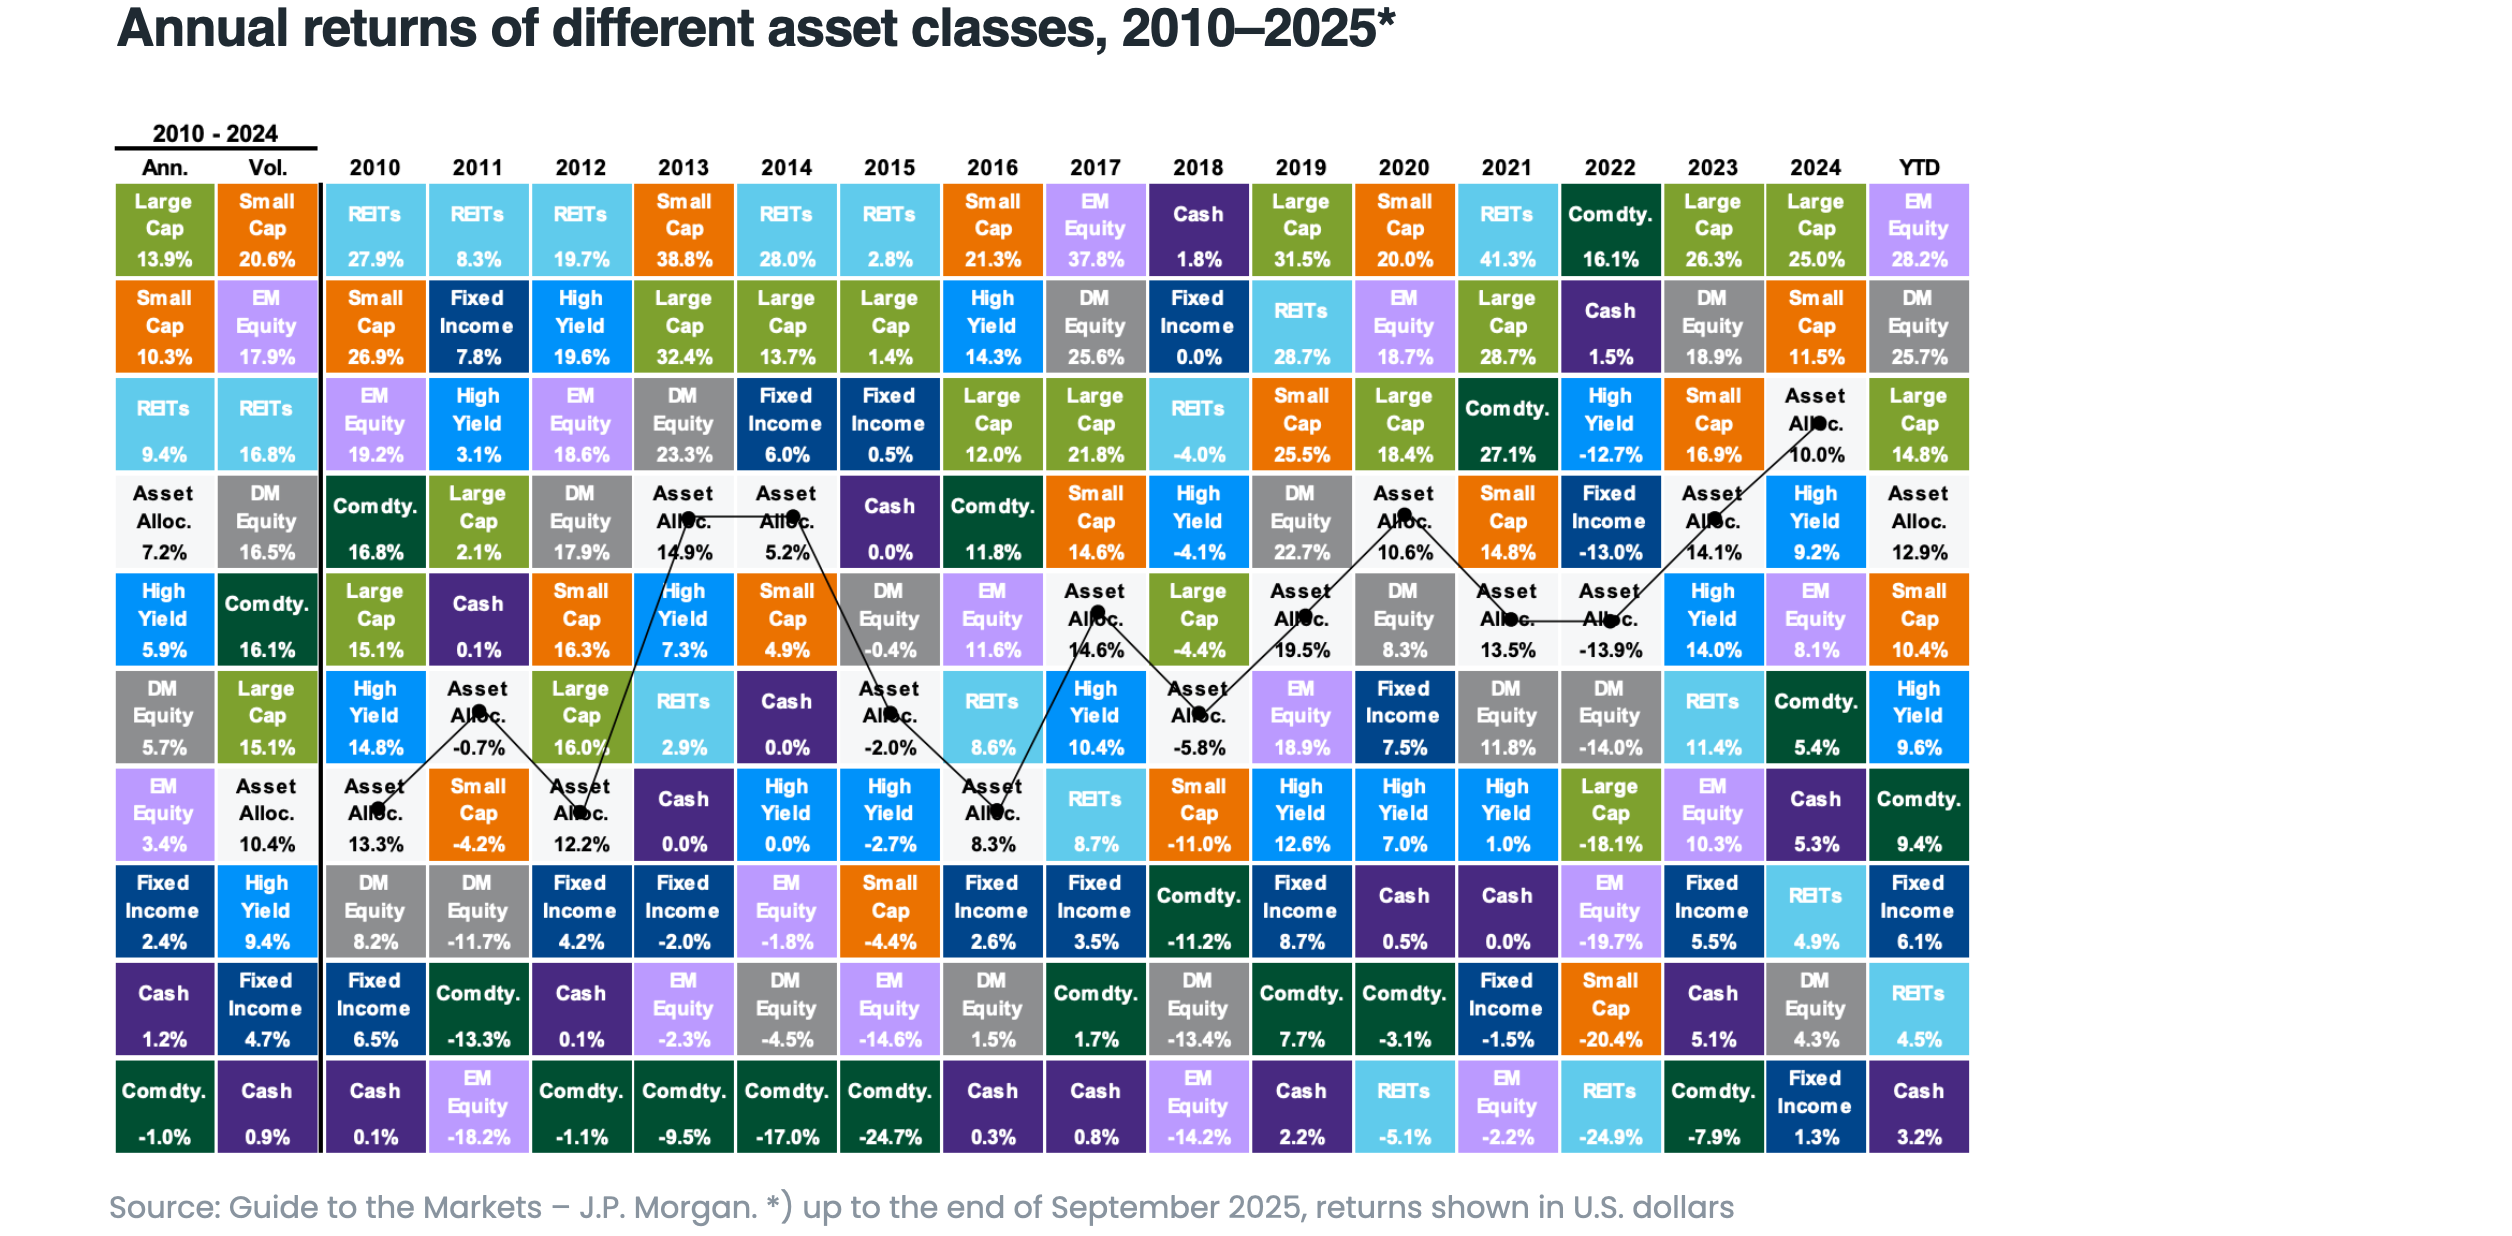
The chart below shows how different asset classes performed between 2010 and 2025. As you can see, the largest U.S. companies aren’t always at the top when it comes to returns.
2. The Cost of Diversification
Diversification is the foundation of safe investing. It lowers risk, keeps the portfolio steady and lets people sleep soundly when markets drop. The problem is, diversification also reduces potential gains.
The classic 60/40 portfolio (60% shares, 40% bonds), often seen as a “gold standard”, usually loses out to pure exposure to the S&P 500 when U.S. stocks are booming. This does not mean the 60/40 strategy is bad—it only means that safety does not go hand-in-hand with maximum profit.
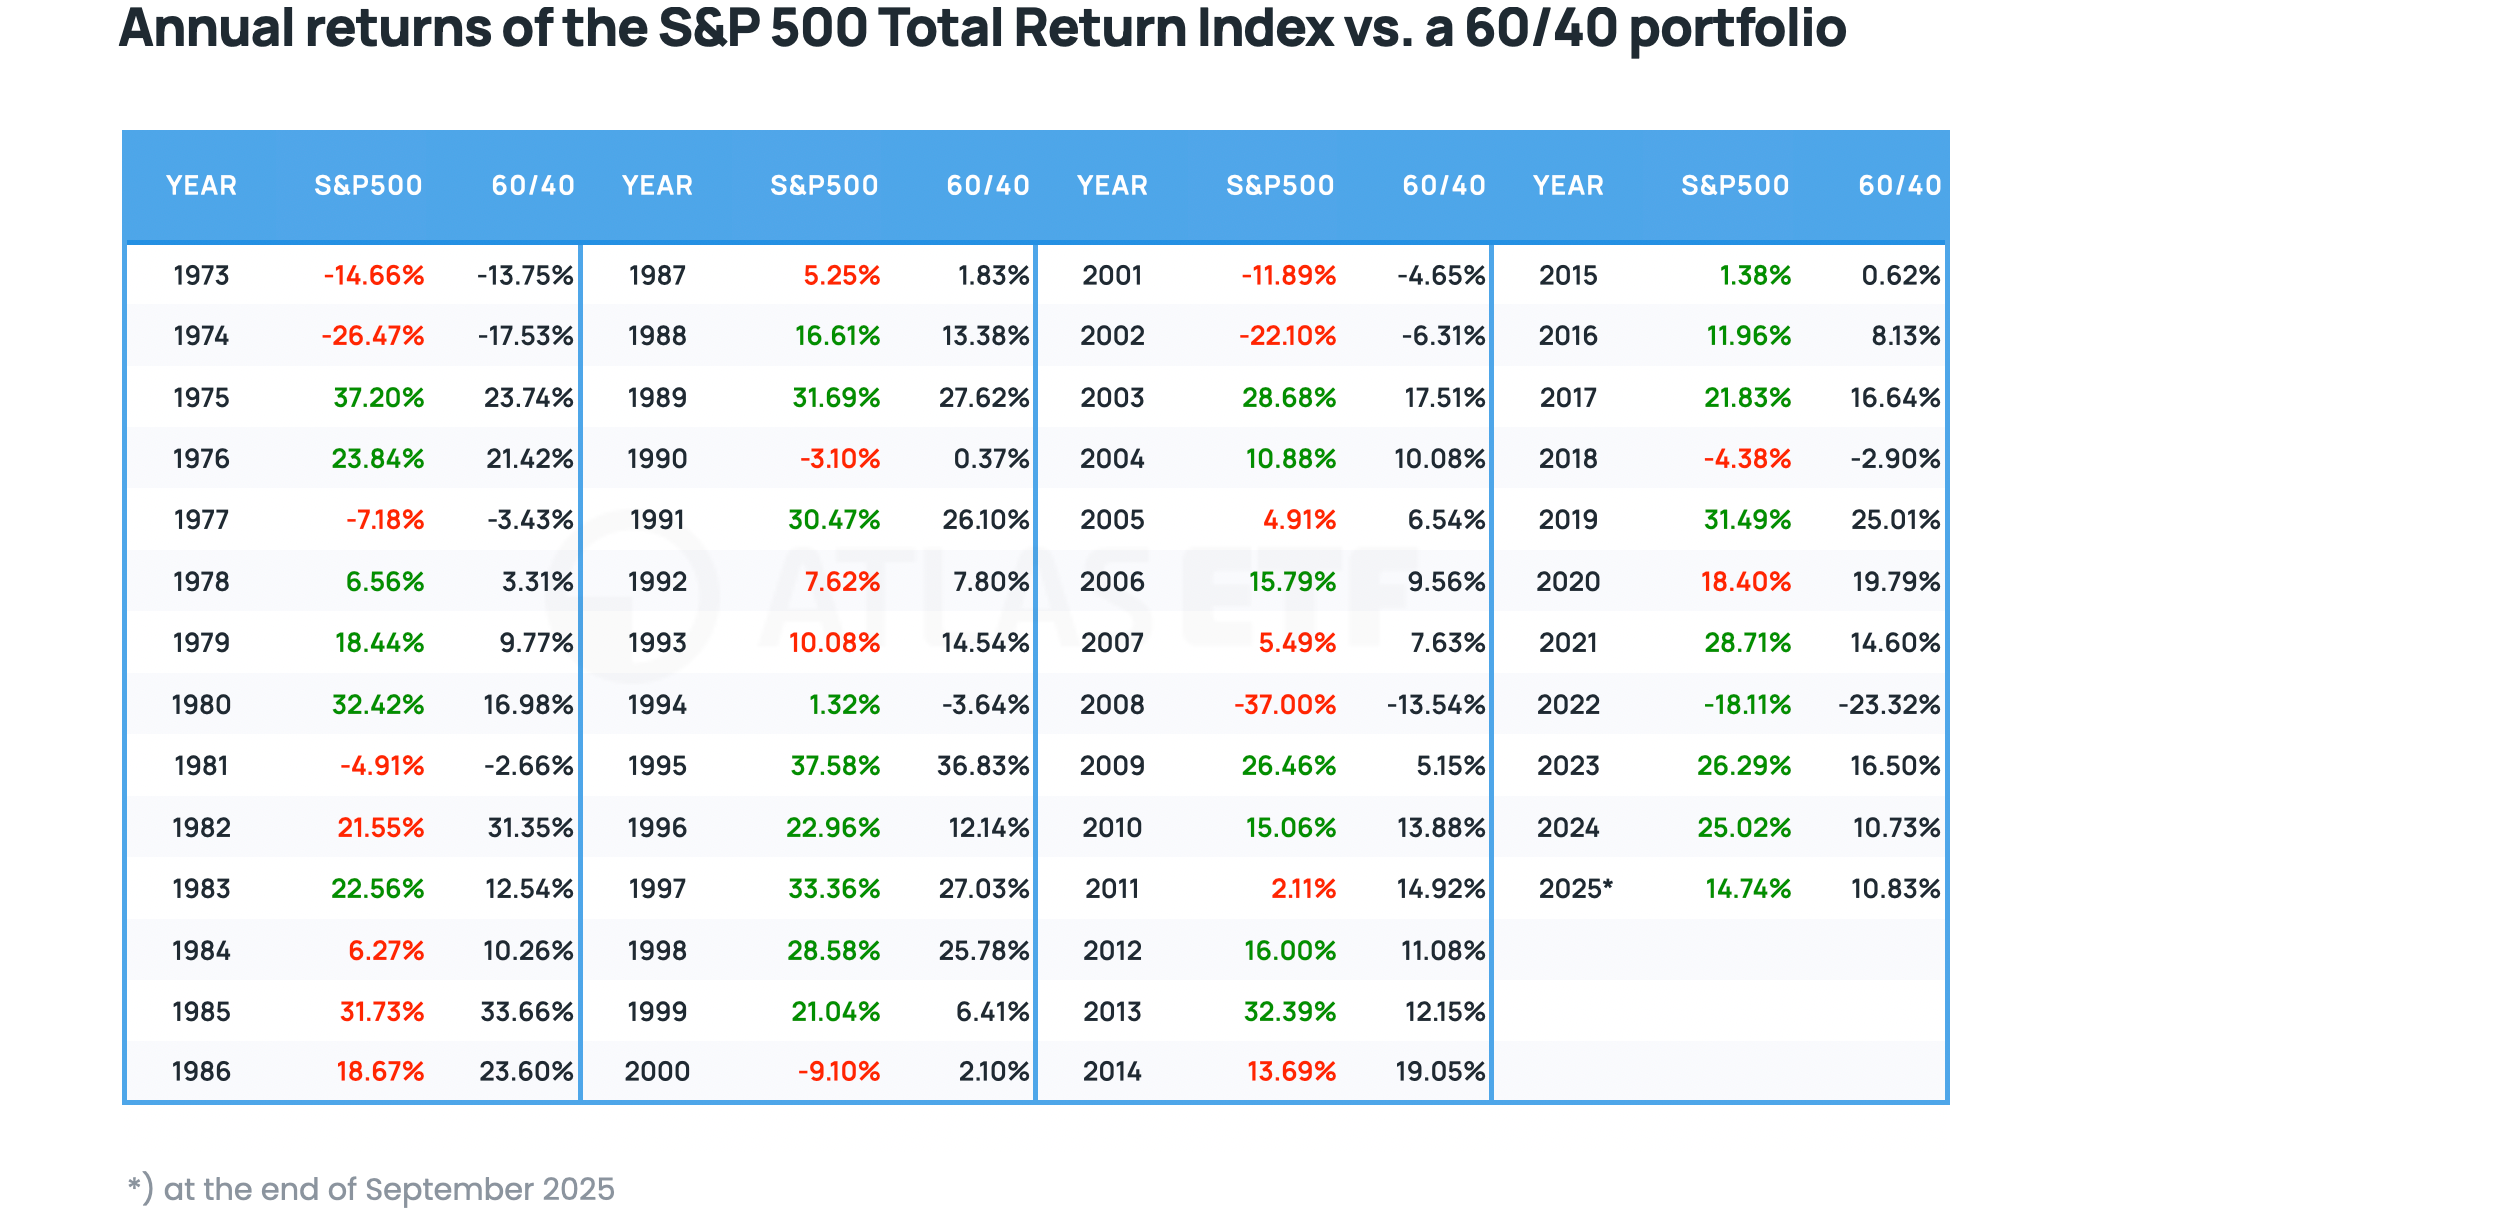
Below is a table comparing yearly returns for the S&P 500 Total Return index and a 60/40 portfolio. In the whole period shown, the S&P 500 did better 32 times in 52 years.
3. The Power of Big Companies
The S&P 500 index is now dominated by a few giant companies like Apple, Microsoft, Amazon, Nvidia and Meta. These companies now make up a large part of the index’s value. When the shares of these giants rise, the index also goes up quickly, which is hard for more cautious portfolios to keep up with.
To better visualize the issue, we have included a chart of the MAGS Roundhill Magnificent Seven ETF, which invests in Magnificent 7 companies (Alphabet (Google), Amazon, Apple, Meta Platforms (Facebook), Microsoft, Nvidia, Tesla), compared to the VOO Vanguard S&P 500 ETF. It now becomes clear how much of the recent return came solely from these seven companies included in the S&P 500 index.

Imagine an investor who only has a small amount of these giants in their portfolio. Even if their portfolio is well thought out, it cannot keep up when the biggest companies suddenly shoot up and boost the index.
4. Investor Psychology
When the S&P 500 is climbing and someone’s portfolio is growing slower, many investors start to get frustrated. They may know their portfolio is less risky and more stable, but they feel like they have “missed an opportunity.” This comparison game makes some people obsessed with beating the index, even if their own investing goals (such as safety or regular income) are completely different.
This pressure to “win” against the S&P 500 is mostly a psychological trap.
When can our portfolio beat the S&P 500?
Although the S&P 500 often comes out on top, it is not invincible. There are moments when diversification and more careful strategies come out ahead.
- Years of large drops – in 2000-2002 or 2008, the S&P 500 index lost more than 50%. Portfolios that included bonds or commodities performed much better then.
- Periods of high inflation – diversification into gold, for example, can give you a noticeable advantage.
- Booms in other parts of the world – sometimes, emerging markets or Europe have done better than the American blue-chip companies.
In other words, a diversified portfolio will usually lag in an American bull market, but does better when the US economy is slowing down and investors look for profits in other global markets.
The problem with comparisons
Every investor should understand one thing: your benchmark must match your investment strategy. If someone builds a portfolio from bonds, dividend stocks and property, then comparing their investment results to the S&P 500 does not make sense. It’s like comparing a family car to a Formula 1 racing car – both drive, but each has a completely different role.
Instead of obsessively checking if “you are beating the index,” ask yourself these questions:
- Is my portfolio right for my goals?
- Am I taking the kind of risk that I can accept?
- Can I sleep well, no matter what is happening on the markets?
A long-term perspective
The biggest ally in investing is time. Short-term “losses” against the S&P 500 are absolutely normal, even among professional investors. Studies show that most actively managed funds cannot consistently beat the index. But does that mean individual investors have no chance?
No. It just means that the S&P 500 may be the best choice for those who fully accept its risk and swings. For those who prefer safety, stable passive income, or want to protect their money in a crisis, a portfolio tailored to their profile is more suitable – even if it sometimes falls behind the index over long periods.
Practical example
Let’s imagine two investors:
- Olivia invests in an ETF that tracks the S&P 500 and keeps it for 25 years.
- James builds a portfolio: 50% global shares, 30% government bonds, 10% gold, 10% property (REITs).
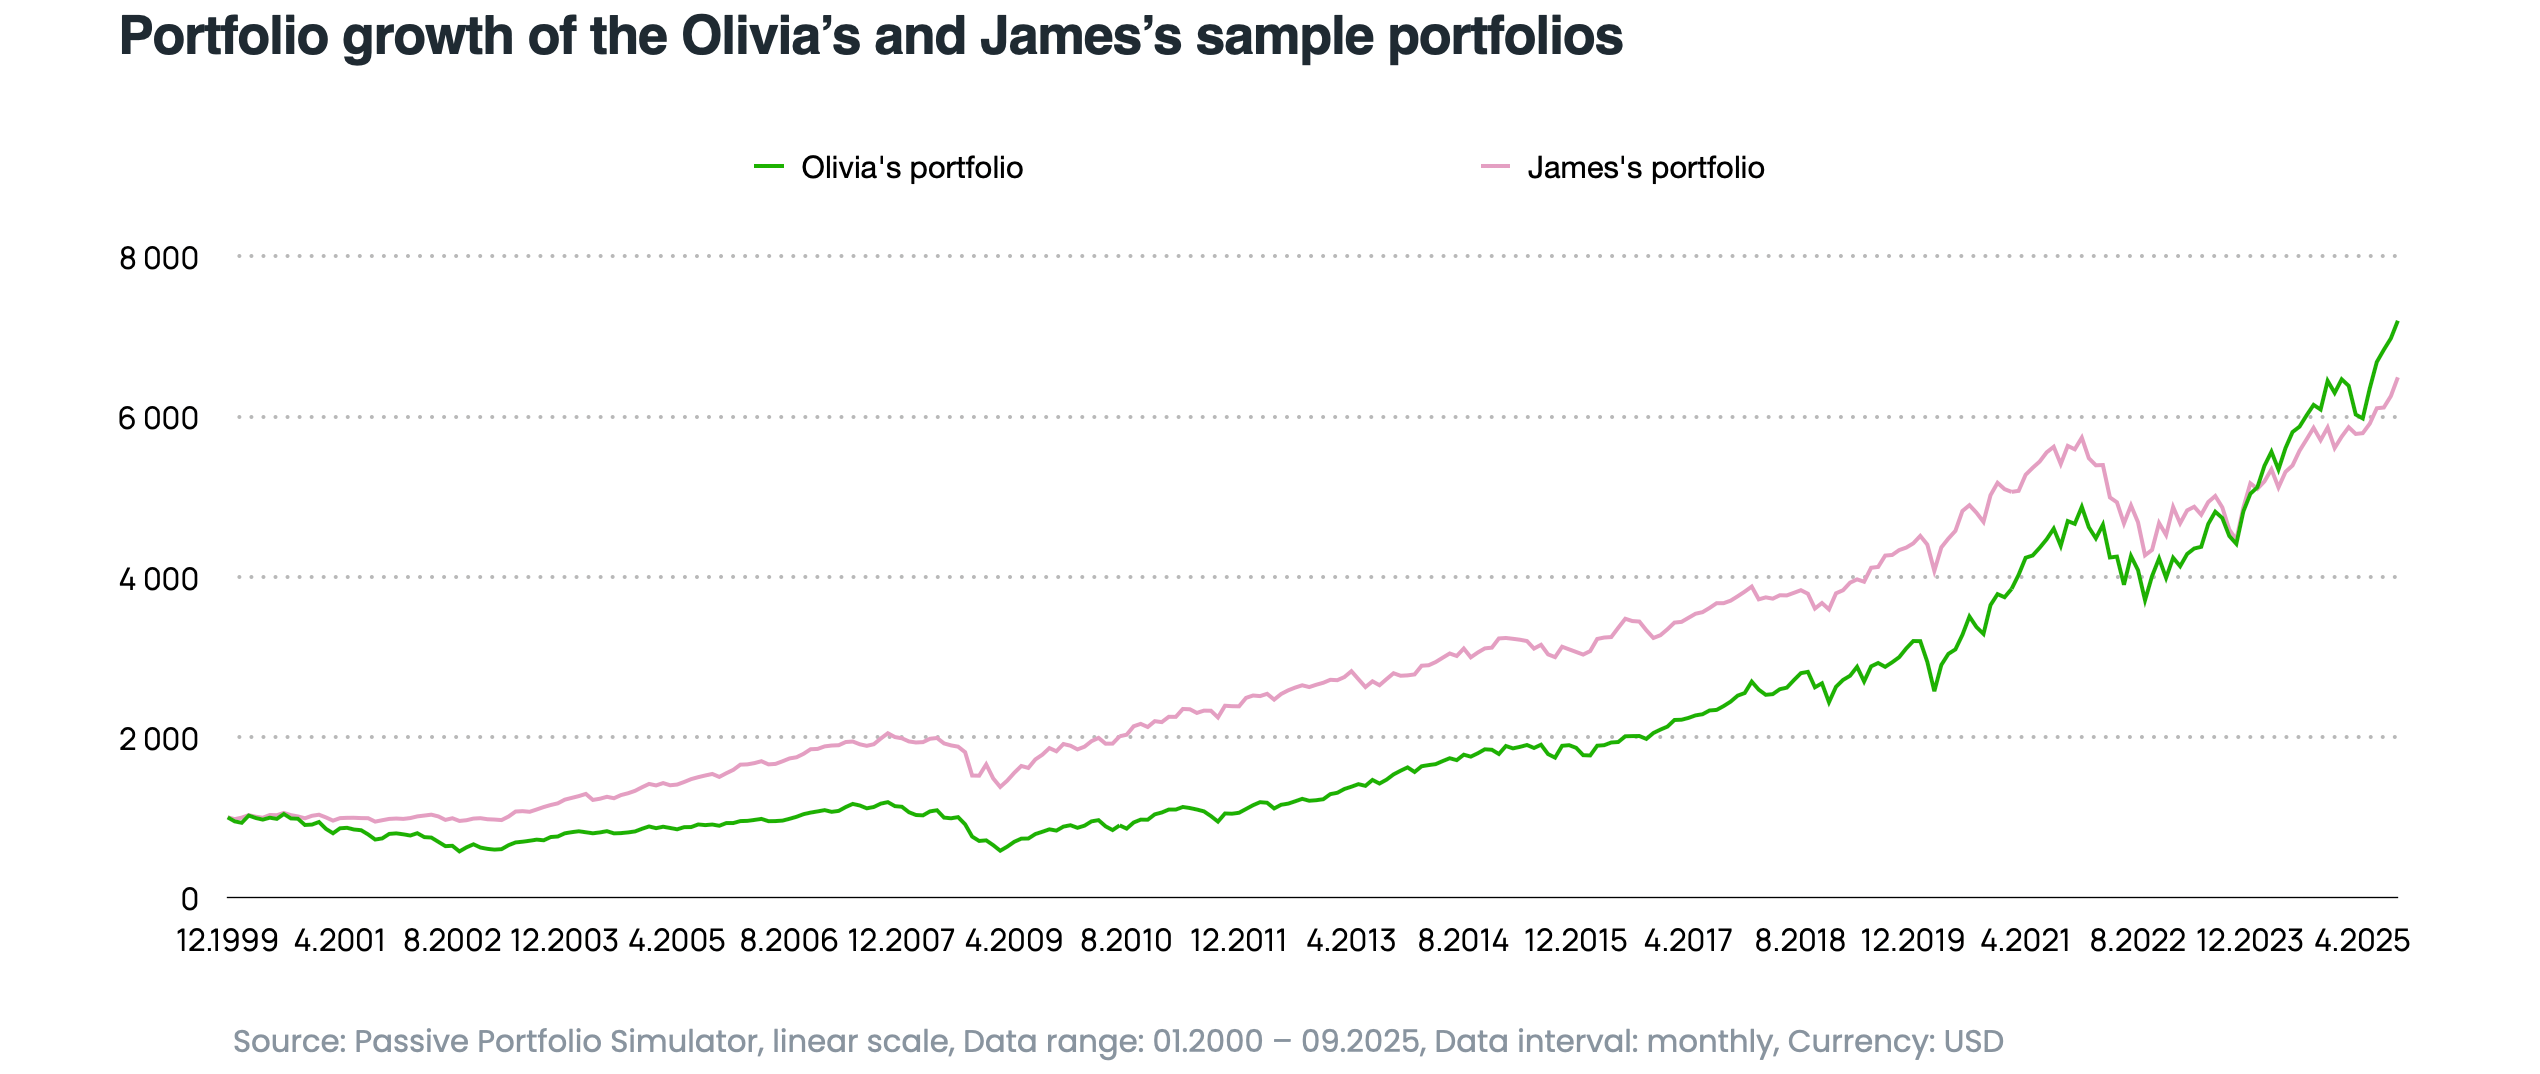
Over 25 years, Olivia will probably achieve a higher return if the USA stays the global growth leader. But James will experience much less volatility, and in times of crisis, his portfolio will fall only half as much.
Which approach is better? It depends not on the index, but on the investor’s goal. If James needs his capital to live through tougher times, his result compared to the S&P 500 does not matter much.
A simulation using our Passive Portfolio Simulator from January 2000 to September 2025 showed these results:
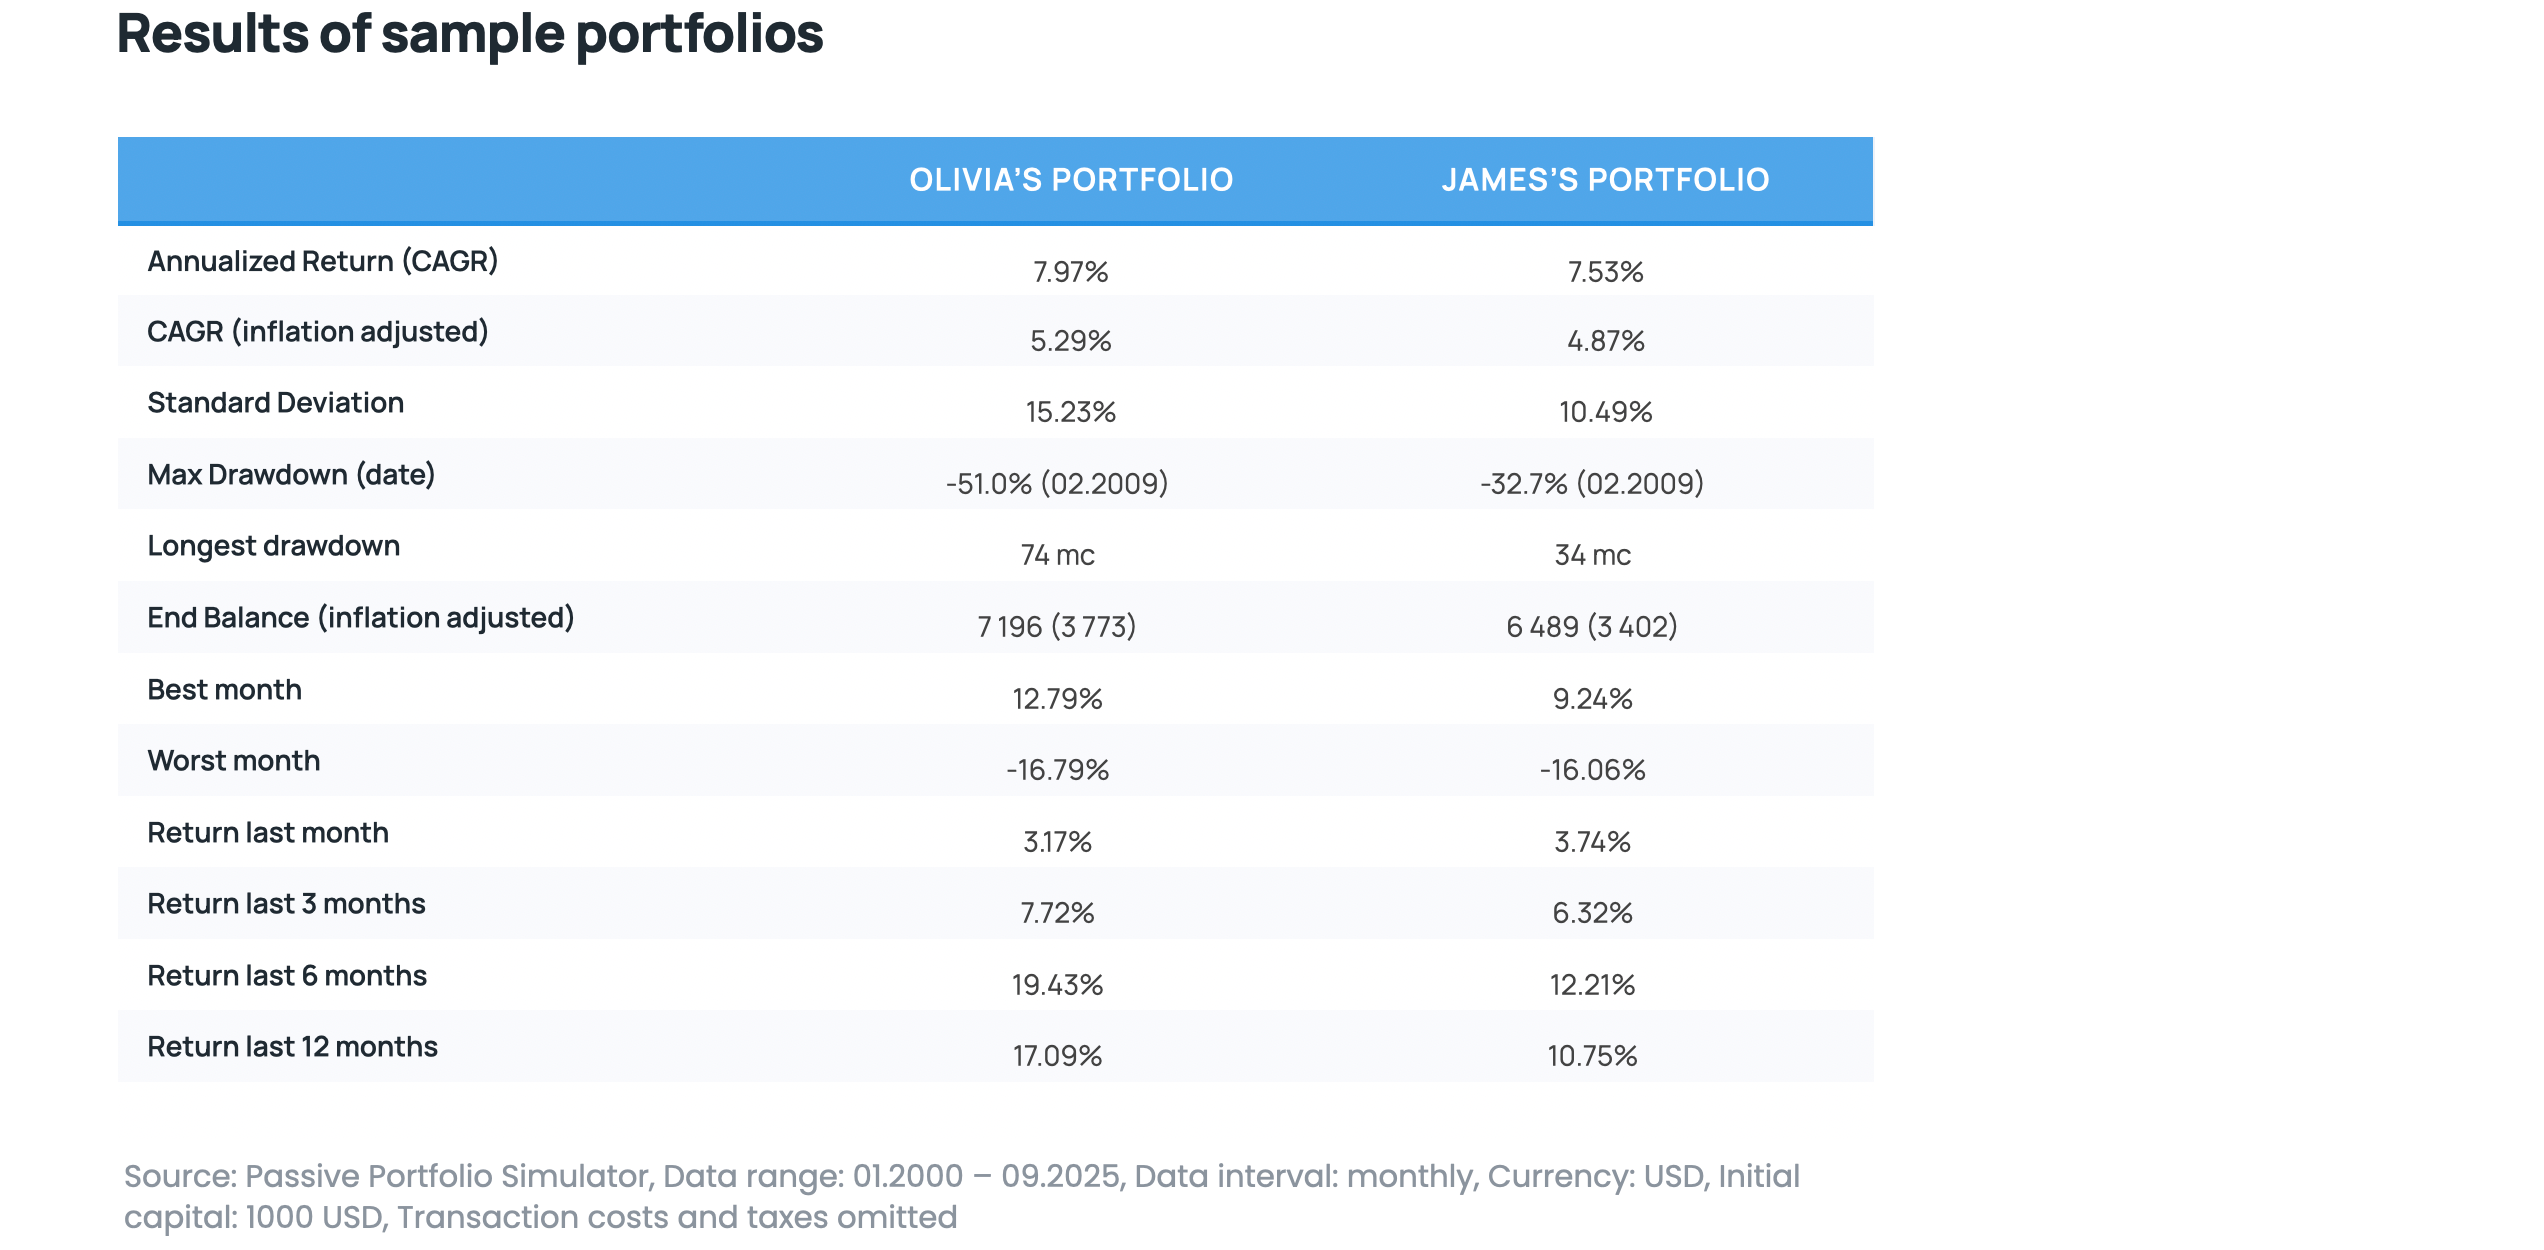
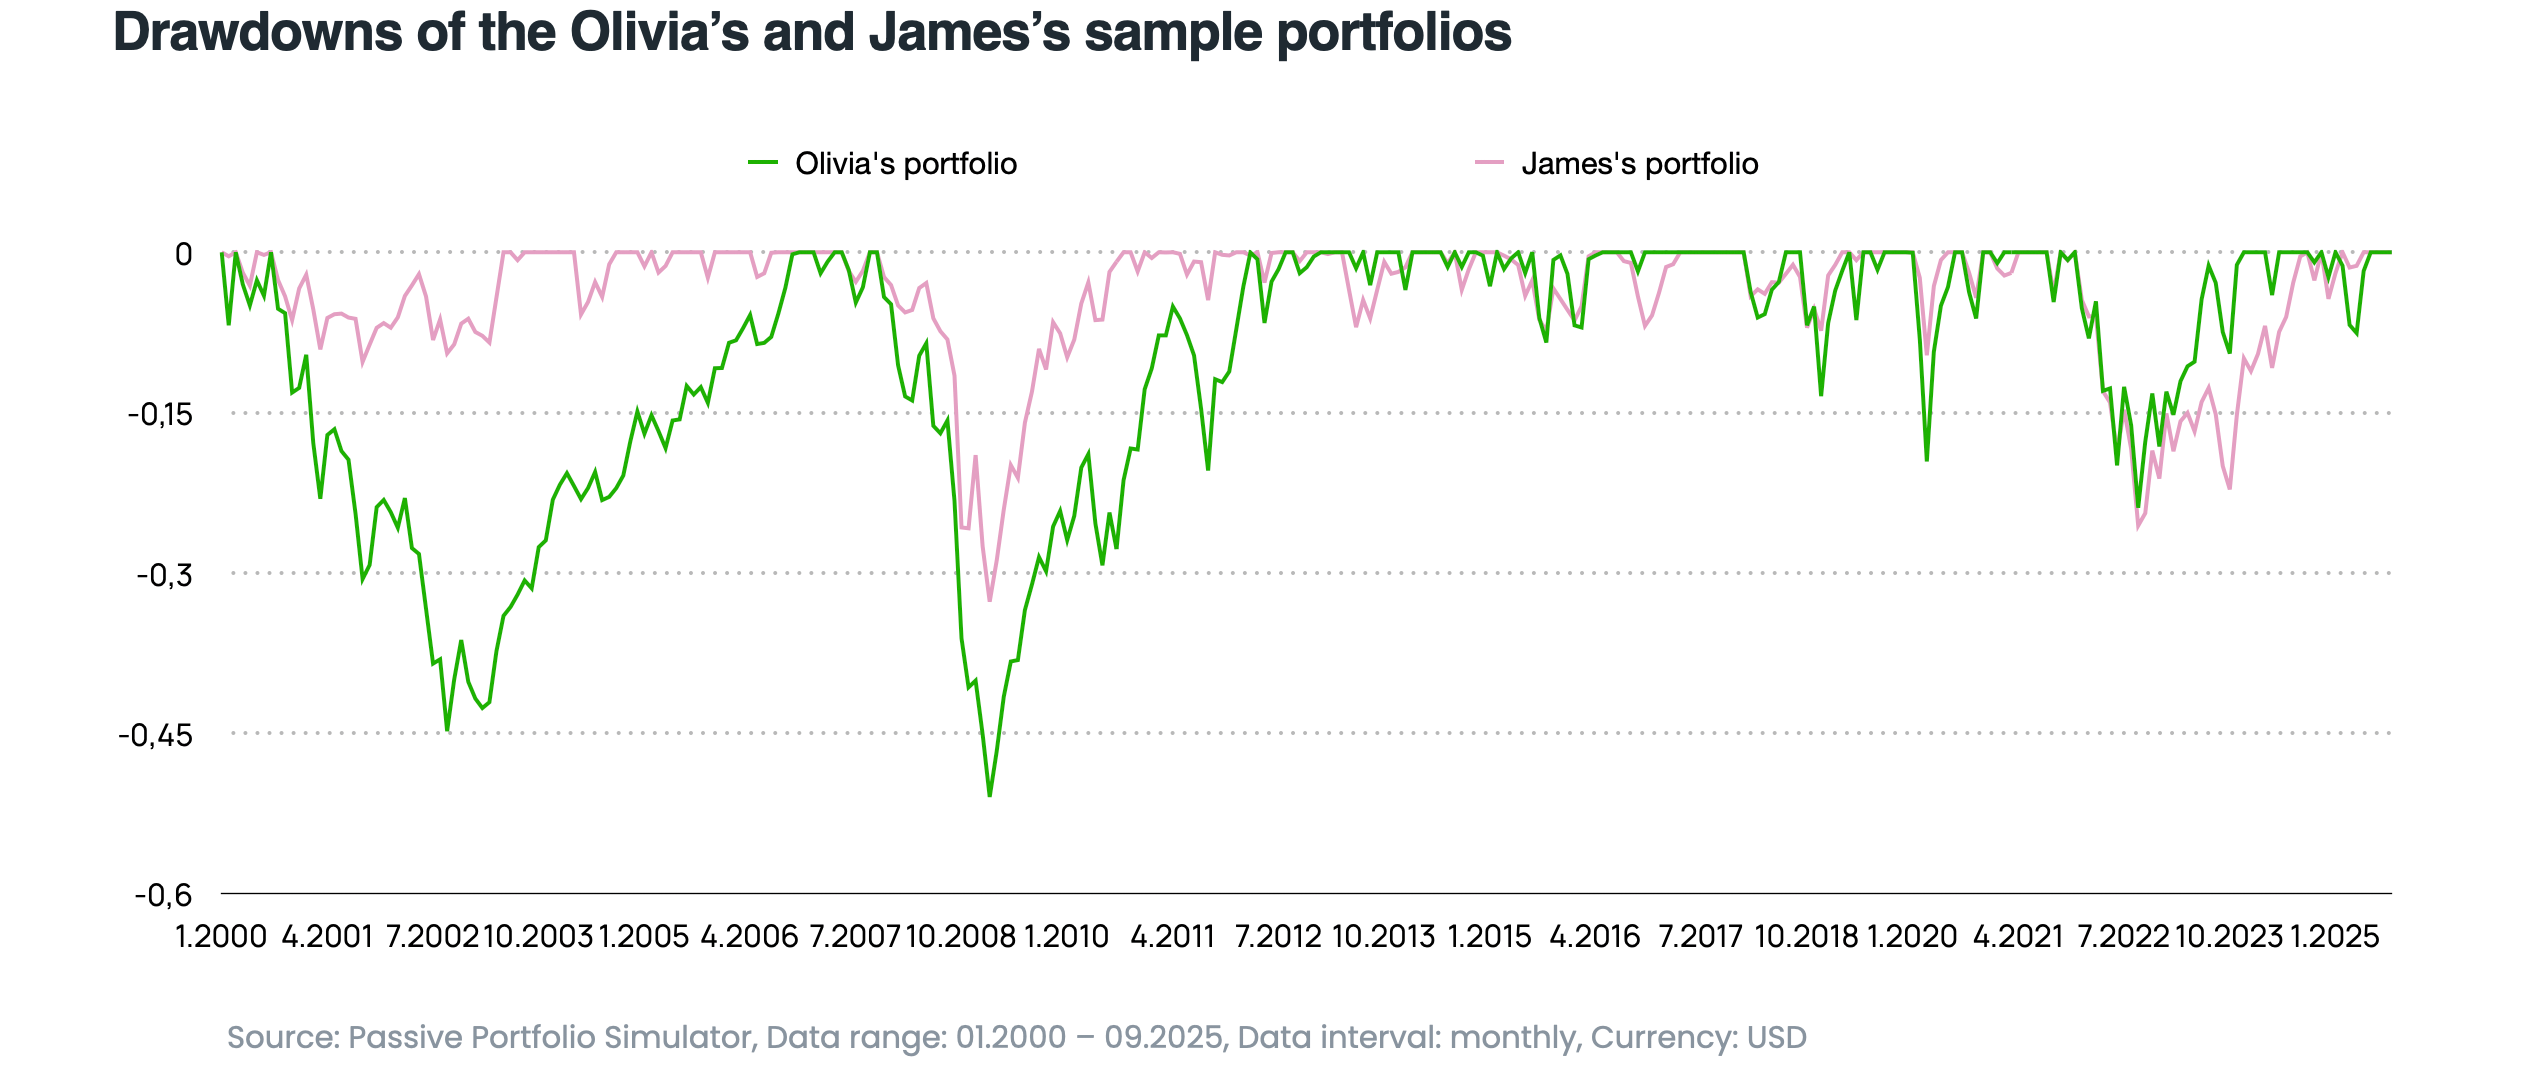
The results of comparing Olivia’s and James’s portfolios clearly show how different investment strategies translate into outcomes—not only in terms of profit but also risk and resilience to losses. A strictly equity-focused portfolio can outperform for years, but a key trade-off is the risk of deep drawdowns and long waits to recover from losses. A diversified portfolio (e.g., including bonds, gold, or REITs) offers noticeably lower volatility and faster “healing” after market downturns, even though the ultimate profit may be somewhat lower.
Below is a chart of the maximum drawdown for both portfolios. Olivia’s portfolio experienced significantly deeper drawdowns during almost every major market crisis. At the peak of the global financial crisis in 2008–2009, the drawdown exceeded -50%. By comparison, James’s portfolio lost around -33% in the same period. The drawdowns in James’s portfolio are noticeably shallower and shorter – even in tougher moments, the portfolio recovers much faster to its previous highs, and the psychological impact (enduring a bear market) is less severe.
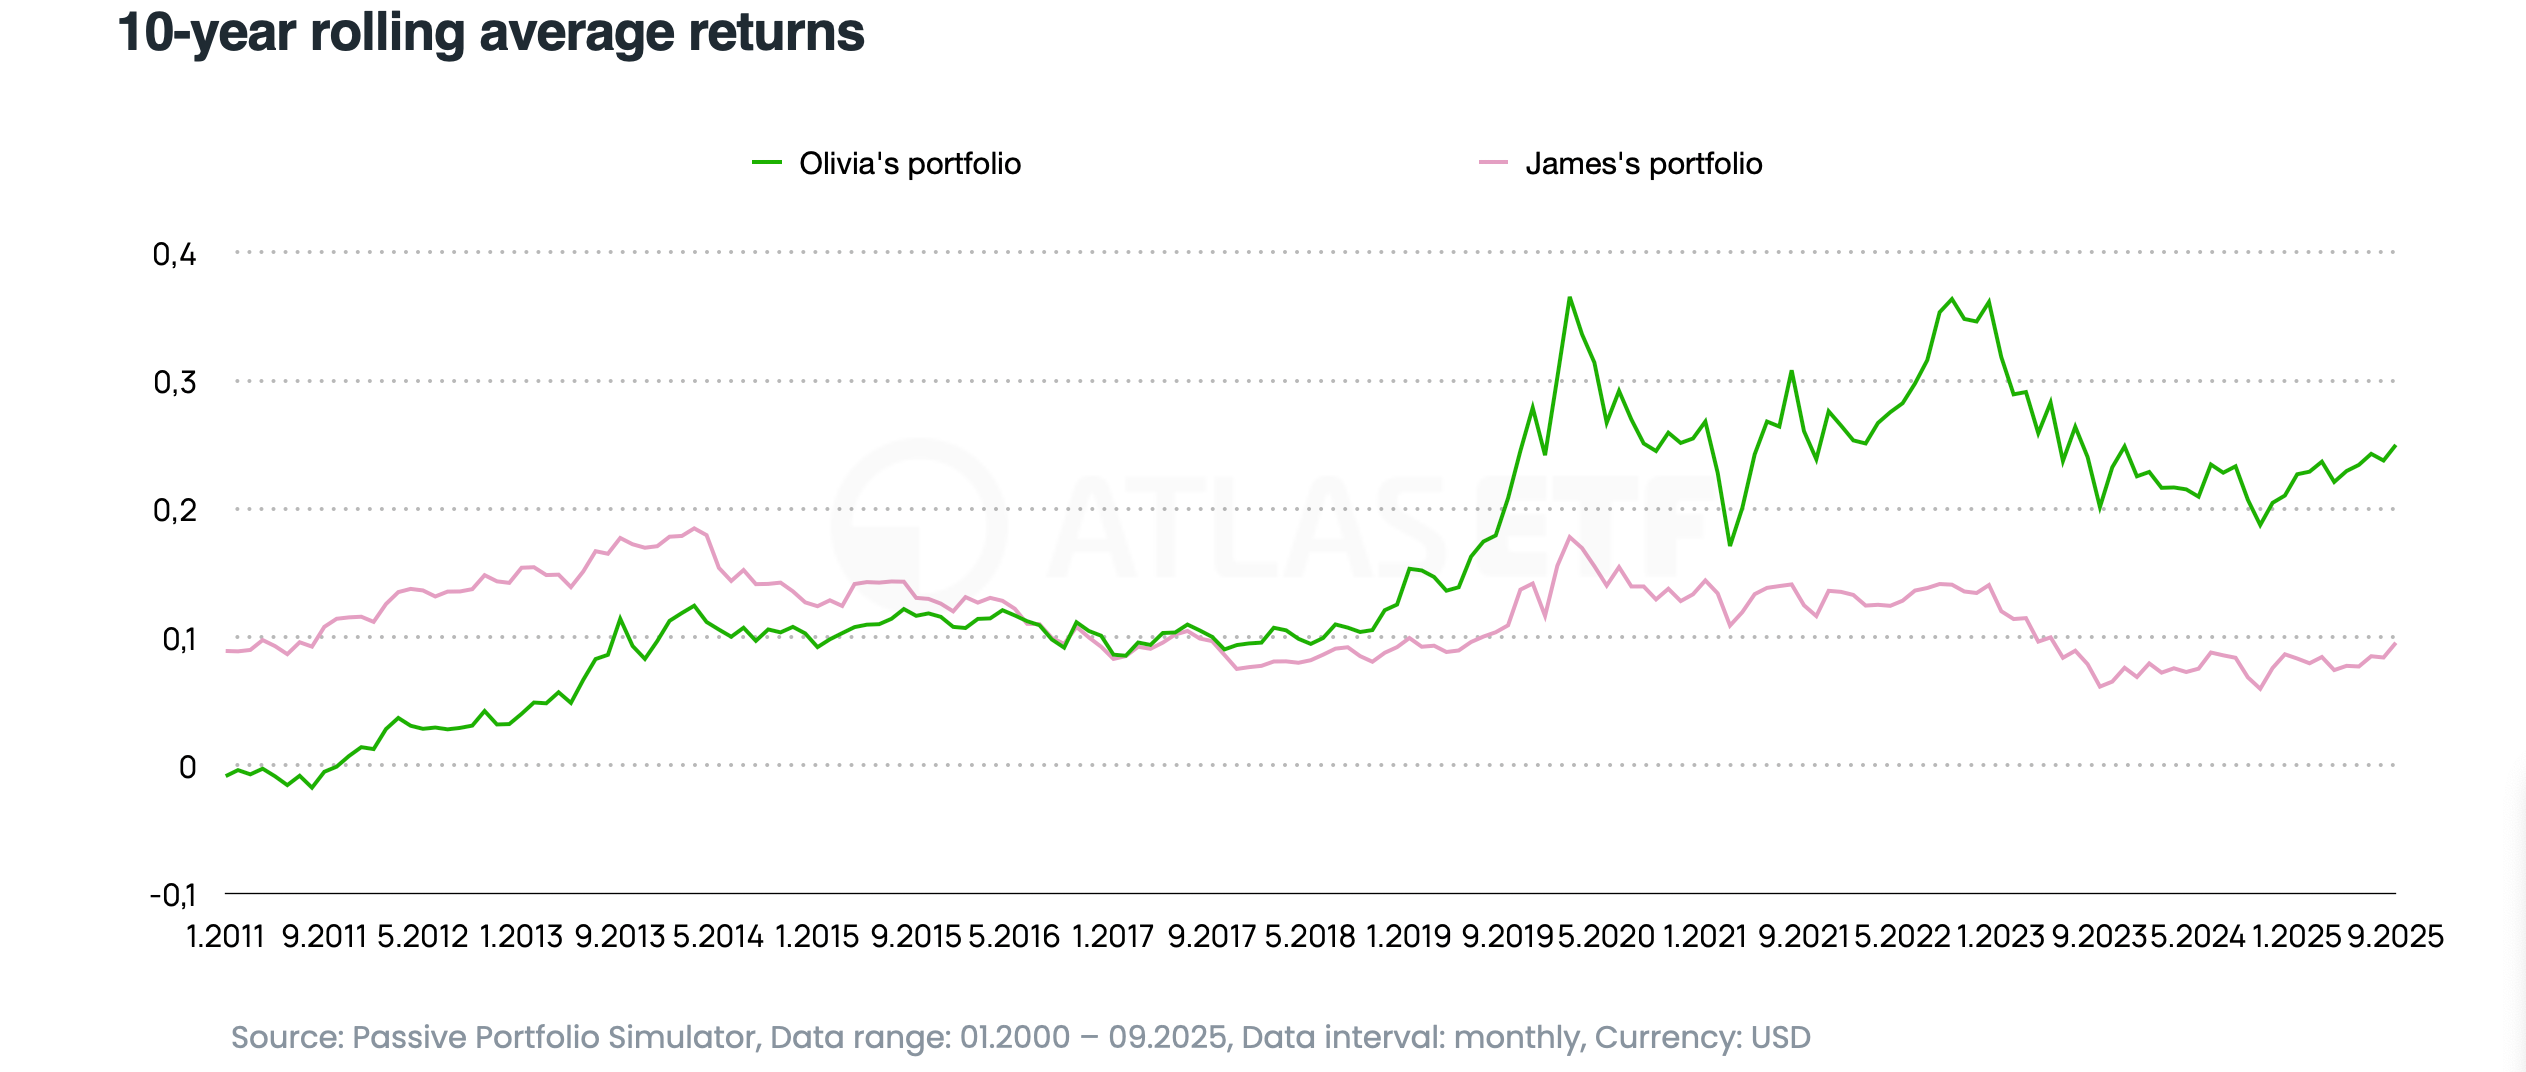
Let’s also look at the 10-year rolling average returns of the analyzed portfolios. Each point on the curve shows the average annual return an investor would have achieved if they’d invested 10 years earlier and held that strategy for the entire decade.
For an investor with a lower risk tolerance, James’s portfolio delivered predictable returns regardless of market conditions. However, for those willing to accept higher volatility, patience with Olivia’s portfolio was rewarded by periods when it outperformed any other strategy. This chart clearly illustrates why constantly “comparing yourself to the S&P 500” can be so difficult and misleading—every strategy has its moment!
Lessons for investors
- Losing to the S&P 500 does not mean you made a mistake – it’s simply the cost of diversification and safety.
- Every portfolio should have its own benchmark, chosen according to the investment goal, not just compared to the index.
- The point of investing is not to be “better than the market,” but to reach your own financial security and independence.
- The psychology of comparisons is risky – instead of looking sideways, focus ahead, on your own goals.
Summary
Every portfolio, even the best built, will sometimes lose out to the S&P 500. This is normal and should not cause frustration. The key thing is to understand that the index is only a point of reference, not the end goal itself. The real success in investing is following your own long-term financial plans while keeping an acceptable level of risk.
What matters most is having a strategy and sticking to it for decades, not just a year or two. Then, even if you “lose” to the S&P 500 over some years, you are still winning in a much more important area – by achieving your own financial path and security.